Share with a co-worker
All Resources
Use case

The Challenge
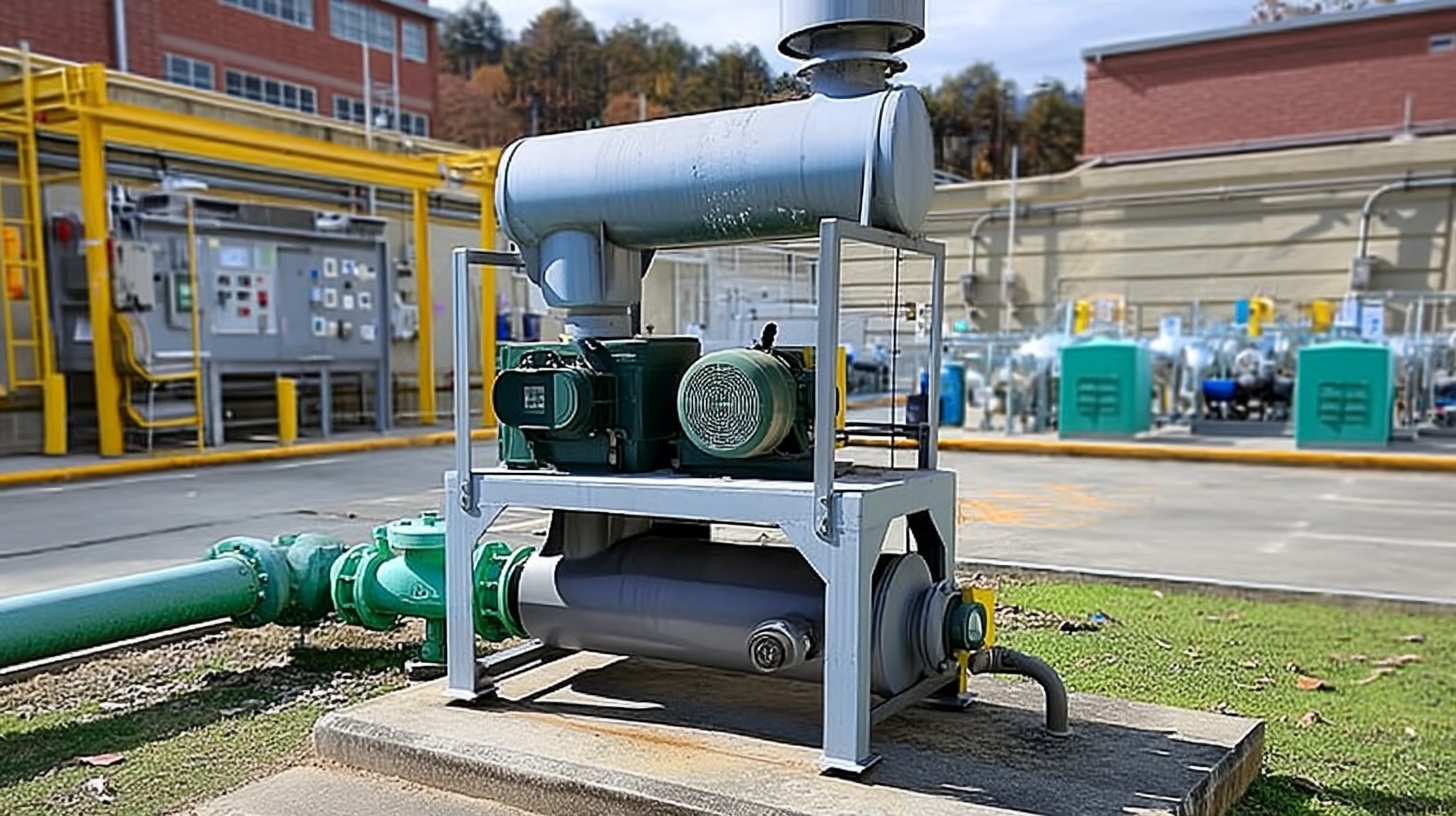
Every time a compressor trips, a blower is activated to replace it and maintain the process load without reducing throughput. Operationally, this prevents immediate production losses. Financially, however, the real question remained unanswered: is the blower truly worth the investment?
Without a clear quantification of how often the blower was used and for how long, it was impossible to compare its operating impact against its capital and operational cost. The organization needed objective data to support investment decisions.
- No consolidated view of compressor trip duration over a year
- Unclear total operating hours of the blower replacing compressors
- Difficulty comparing blower usage against its cost
- Investment decision based on assumptions rather than measured data
The Approach
The team implemented a structured reporting logic to quantify blower utilization during compressor trips over a defined annual window.
- Trip replacement detection logic: A binary formula combining IF and OR conditions was created to detect operating windows where the blower replaced a tripped compressor
- Operating window aggregation: One full year was defined in the focus chart to capture representative operational behavior
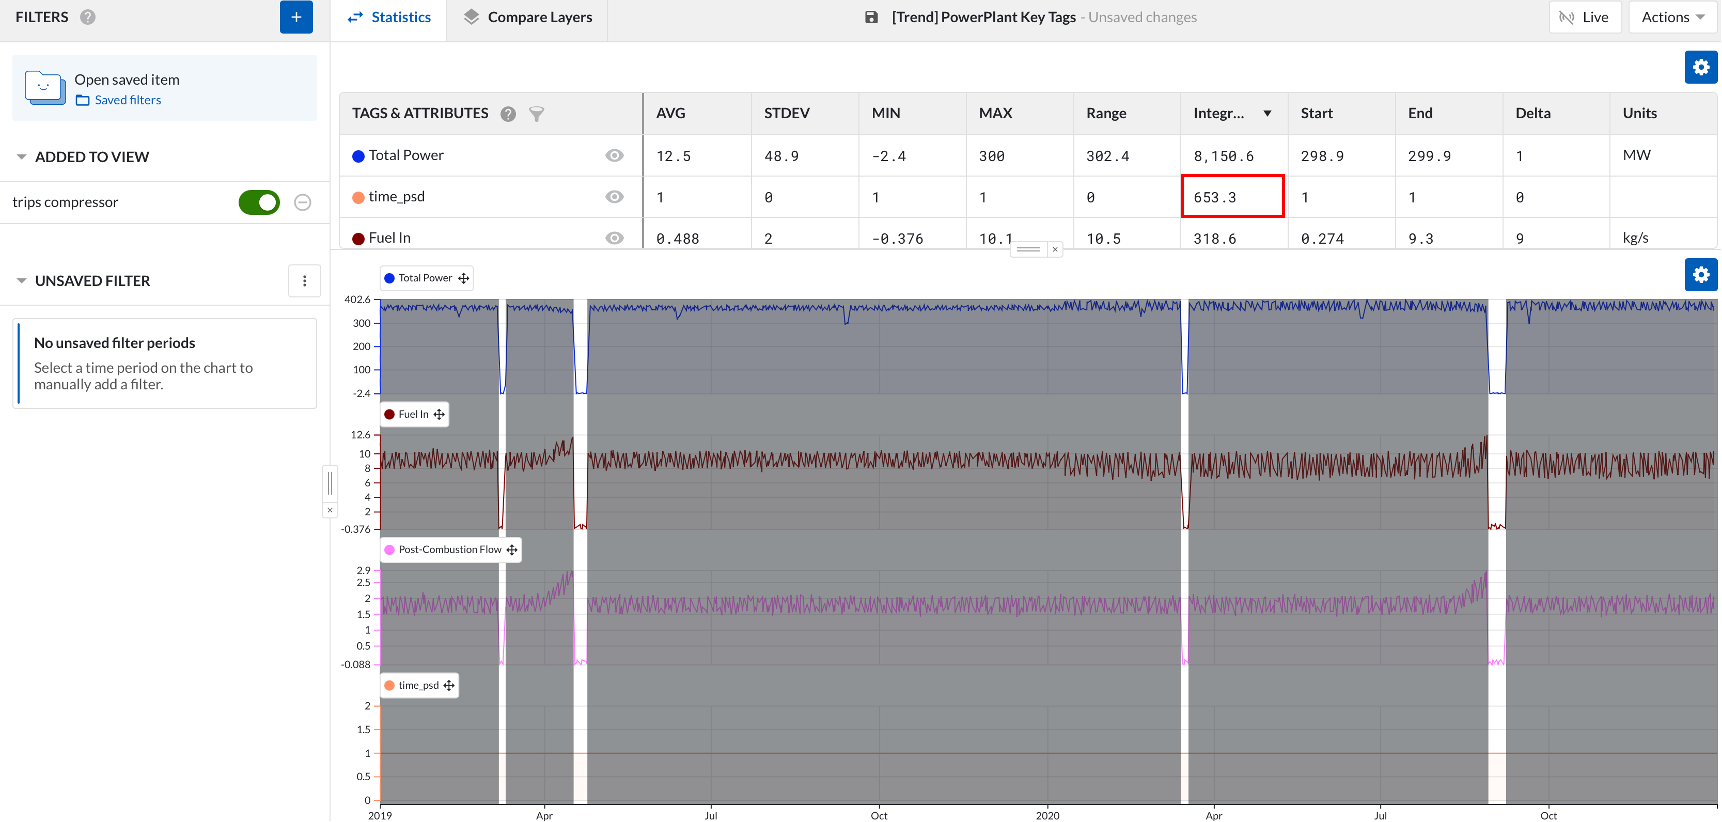
- Usage quantification: Statistics tables were used to calculate the integral of the binary formula, converting detected windows into total usage hours
- Financial comparison basis: The calculated annual blower operating hours provided a measurable basis to compare reduced load losses versus blower cost
Key Insight
By transforming trip replacement events into a quantifiable KPI, blower usage shifted from anecdotal perception to measurable economic evaluation.
Results
The Takeaway
With 150+ hours of annual blower usage quantified, the team could directly compare the economic impact of reduced load during those hours against the blower's cost, enabling a fact-based investment decision instead of relying on assumptions about compressor trip frequency.
The Challenge
Every time a compressor trips, a blower is activated to replace it and maintain the process load without reducing throughput. Operationally, this prevents immediate production losses. Financially, however, the real question remained unanswered: is the blower truly worth the investment?
Without a clear quantification of how often the blower was used and for how long, it was impossible to compare its operating impact against its capital and operational cost. The organization needed objective data to support investment decisions.
- No consolidated view of compressor trip duration over a year
- Unclear total operating hours of the blower replacing compressors
- Difficulty comparing blower usage against its cost
- Investment decision based on assumptions rather than measured data
The Approach
The team implemented a structured reporting logic to quantify blower utilization during compressor trips over a defined annual window.
- Trip replacement detection logic: A binary formula combining IF and OR conditions was created to detect operating windows where the blower replaced a tripped compressor
- Operating window aggregation: One full year was defined in the focus chart to capture representative operational behavior
- Usage quantification: Statistics tables were used to calculate the integral of the binary formula, converting detected windows into total usage hours
- Financial comparison basis: The calculated annual blower operating hours provided a measurable basis to compare reduced load losses versus blower cost
Key Insight
By transforming trip replacement events into a quantifiable KPI, blower usage shifted from anecdotal perception to measurable economic evaluation.
Results
The Takeaway
With 150+ hours of annual blower usage quantified, the team could directly compare the economic impact of reduced load during those hours against the blower's cost, enabling a fact-based investment decision instead of relying on assumptions about compressor trip frequency.
Access now
Share with a co-worker
The Challenge
Every time a compressor trips, a blower is activated to replace it and maintain the process load without reducing throughput. Operationally, this prevents immediate production losses. Financially, however, the real question remained unanswered: is the blower truly worth the investment?
Without a clear quantification of how often the blower was used and for how long, it was impossible to compare its operating impact against its capital and operational cost. The organization needed objective data to support investment decisions.
- No consolidated view of compressor trip duration over a year
- Unclear total operating hours of the blower replacing compressors
- Difficulty comparing blower usage against its cost
- Investment decision based on assumptions rather than measured data
The Approach
The team implemented a structured reporting logic to quantify blower utilization during compressor trips over a defined annual window.
- Trip replacement detection logic: A binary formula combining IF and OR conditions was created to detect operating windows where the blower replaced a tripped compressor
- Operating window aggregation: One full year was defined in the focus chart to capture representative operational behavior
- Usage quantification: Statistics tables were used to calculate the integral of the binary formula, converting detected windows into total usage hours
- Financial comparison basis: The calculated annual blower operating hours provided a measurable basis to compare reduced load losses versus blower cost
Key Insight
By transforming trip replacement events into a quantifiable KPI, blower usage shifted from anecdotal perception to measurable economic evaluation.
Results
The Takeaway
With 150+ hours of annual blower usage quantified, the team could directly compare the economic impact of reduced load during those hours against the blower's cost, enabling a fact-based investment decision instead of relying on assumptions about compressor trip frequency.
Access now
Subscribe to our newsletter
Stay up to date with our latest news and updates.
Webinars on Demand
Press Play on Operational Improvement
.jpeg)
.jpeg)
.jpeg)
Other Resources
Explore Our Newest Content to Maximize Your Operational Efficiency