Share with a co-worker
.jpg)

About the webinar
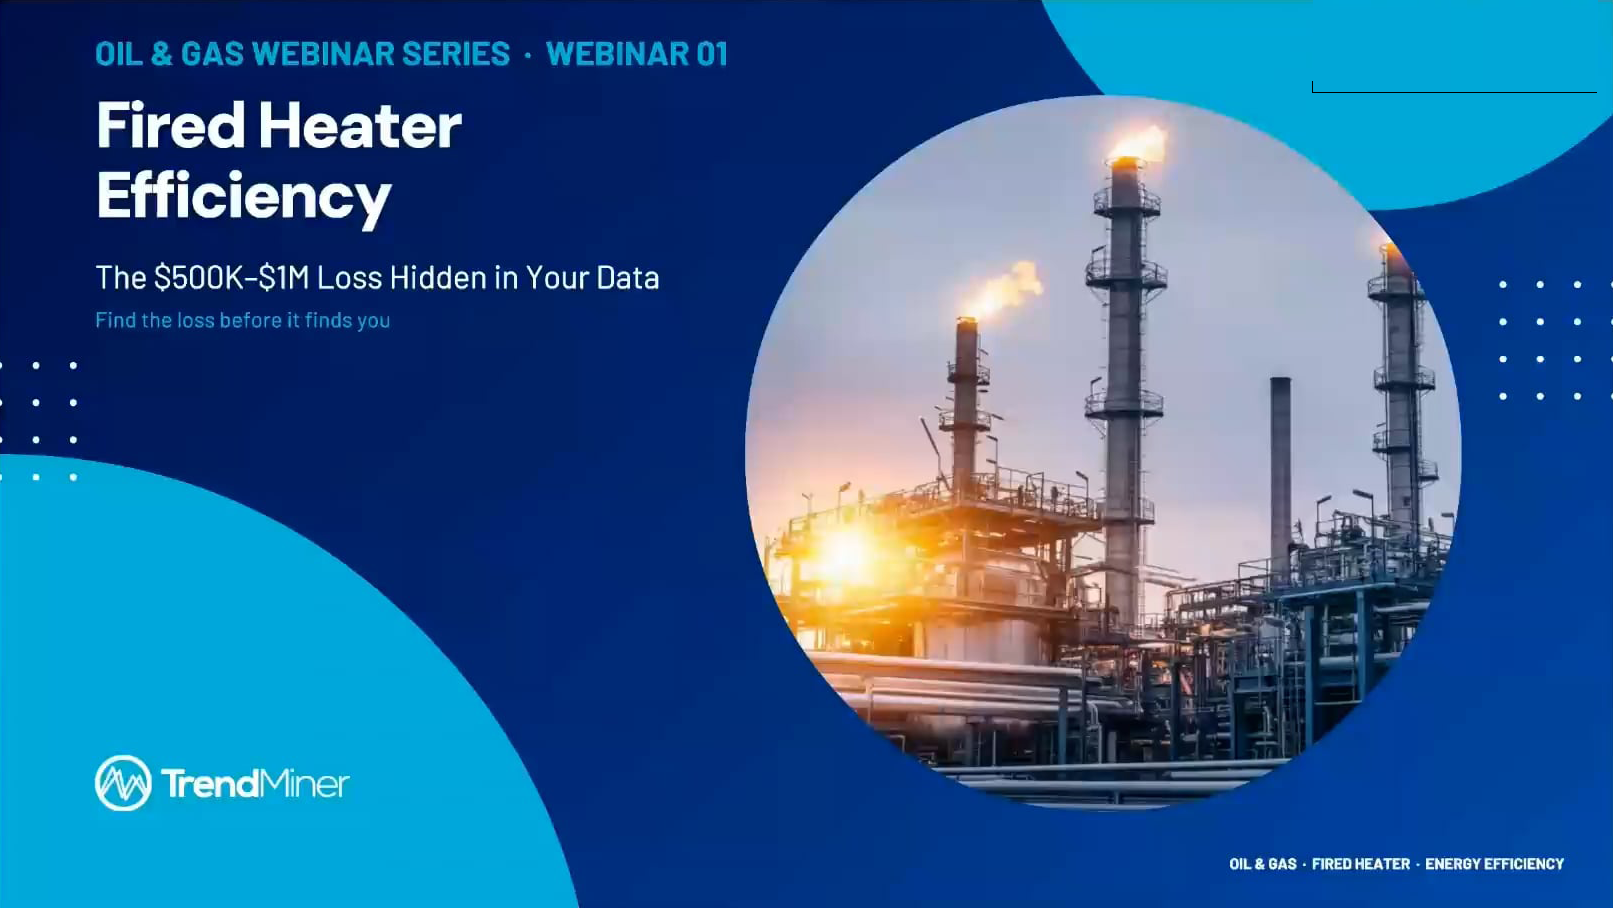
In this on-demand webinar, we use a real Preheat Train dataset to show how to identify the optimal HEX cleaning point before fouling and energy losses create a €500k impact.
What you'll learn
- Calculating the U Coefficient with Tag Builder and tracking performance over time
- Using Event Analytics to detect cleaning cycles, compare events, and calculate end U, end flow and crude outlet temperature to visualize heat transfer performance
- Finding the cleaning sweet spot through scatter plot analysis for economic evaluation
- Creating UCL & LCL limits with 5% tolerance and automated monitors
- Building gauges and dashboards to monitor and sustain performance improvements
Who should watch
Process Engineers, Production Managers, Maintenance Engineers, Operations Managers, Data Scientists and Analysts, Digital Transformation Leaders, Plant Managers, and Sustainability Managers.
Complete the form to watch the full recording on demand.
About the webinar
In this on-demand webinar, we use a real Preheat Train dataset to show how to identify the optimal HEX cleaning point before fouling and energy losses create a €500k impact.
What you'll learn
- Calculating the U Coefficient with Tag Builder and tracking performance over time
- Using Event Analytics to detect cleaning cycles, compare events, and calculate end U, end flow and crude outlet temperature to visualize heat transfer performance
- Finding the cleaning sweet spot through scatter plot analysis for economic evaluation
- Creating UCL & LCL limits with 5% tolerance and automated monitors
- Building gauges and dashboards to monitor and sustain performance improvements
Who should watch
Process Engineers, Production Managers, Maintenance Engineers, Operations Managers, Data Scientists and Analysts, Digital Transformation Leaders, Plant Managers, and Sustainability Managers.
Complete the form to watch the full recording on demand.
Access now
Share with a co-worker
About the webinar
In this on-demand webinar, we use a real Preheat Train dataset to show how to identify the optimal HEX cleaning point before fouling and energy losses create a €500k impact.
What you'll learn
- Calculating the U Coefficient with Tag Builder and tracking performance over time
- Using Event Analytics to detect cleaning cycles, compare events, and calculate end U, end flow and crude outlet temperature to visualize heat transfer performance
- Finding the cleaning sweet spot through scatter plot analysis for economic evaluation
- Creating UCL & LCL limits with 5% tolerance and automated monitors
- Building gauges and dashboards to monitor and sustain performance improvements
Who should watch
Process Engineers, Production Managers, Maintenance Engineers, Operations Managers, Data Scientists and Analysts, Digital Transformation Leaders, Plant Managers, and Sustainability Managers.
Complete the form to watch the full recording on demand.
Access now
Subscribe to our newsletter
Stay up to date with our latest news and updates.
.jpg)
.jpg)
Other Resources
Explore Our Newest Content to Maximize Your Operational Efficiency