Share with a co-worker
All Resources
Use case


The Challenge
Steam turbine performance was believed to be strongly influenced by several meteorological parameters, particularly atmospheric pressure. Operators also suspected that fan behavior and vacuum pressure variations could indicate hidden performance issues.
However, these assumptions had never been rigorously quantified. Without clear correlation analysis, it was difficult to determine which external factors truly affected turbine efficiency and whether anomalies were present in the system.
- Uncertainty about impact of ambient conditions on turbine performance
- Assumptions regarding atmospheric pressure influence
- Need to quantify relationship between vacuum pressure and environmental variables
- Requirement to detect possible anomalies in fan operation
The Approach
The team conducted a structured correlation and monitoring study using advanced visualization and influence analysis tools.
- Scatter plot analysis, correlations between meteorological variables and turbine parameters were visualized and explored
- Influence factor quantification, statistical tools were used to measure the strength of linear relationships
- Hypothesis testing, assumed drivers such as atmospheric pressure were evaluated against actual data
- Performance validation, historical analysis over two years verified fan stability
- Monitoring implementation, a monitor was activated to detect and notify if abnormal fan behavior occurs
Key Insight
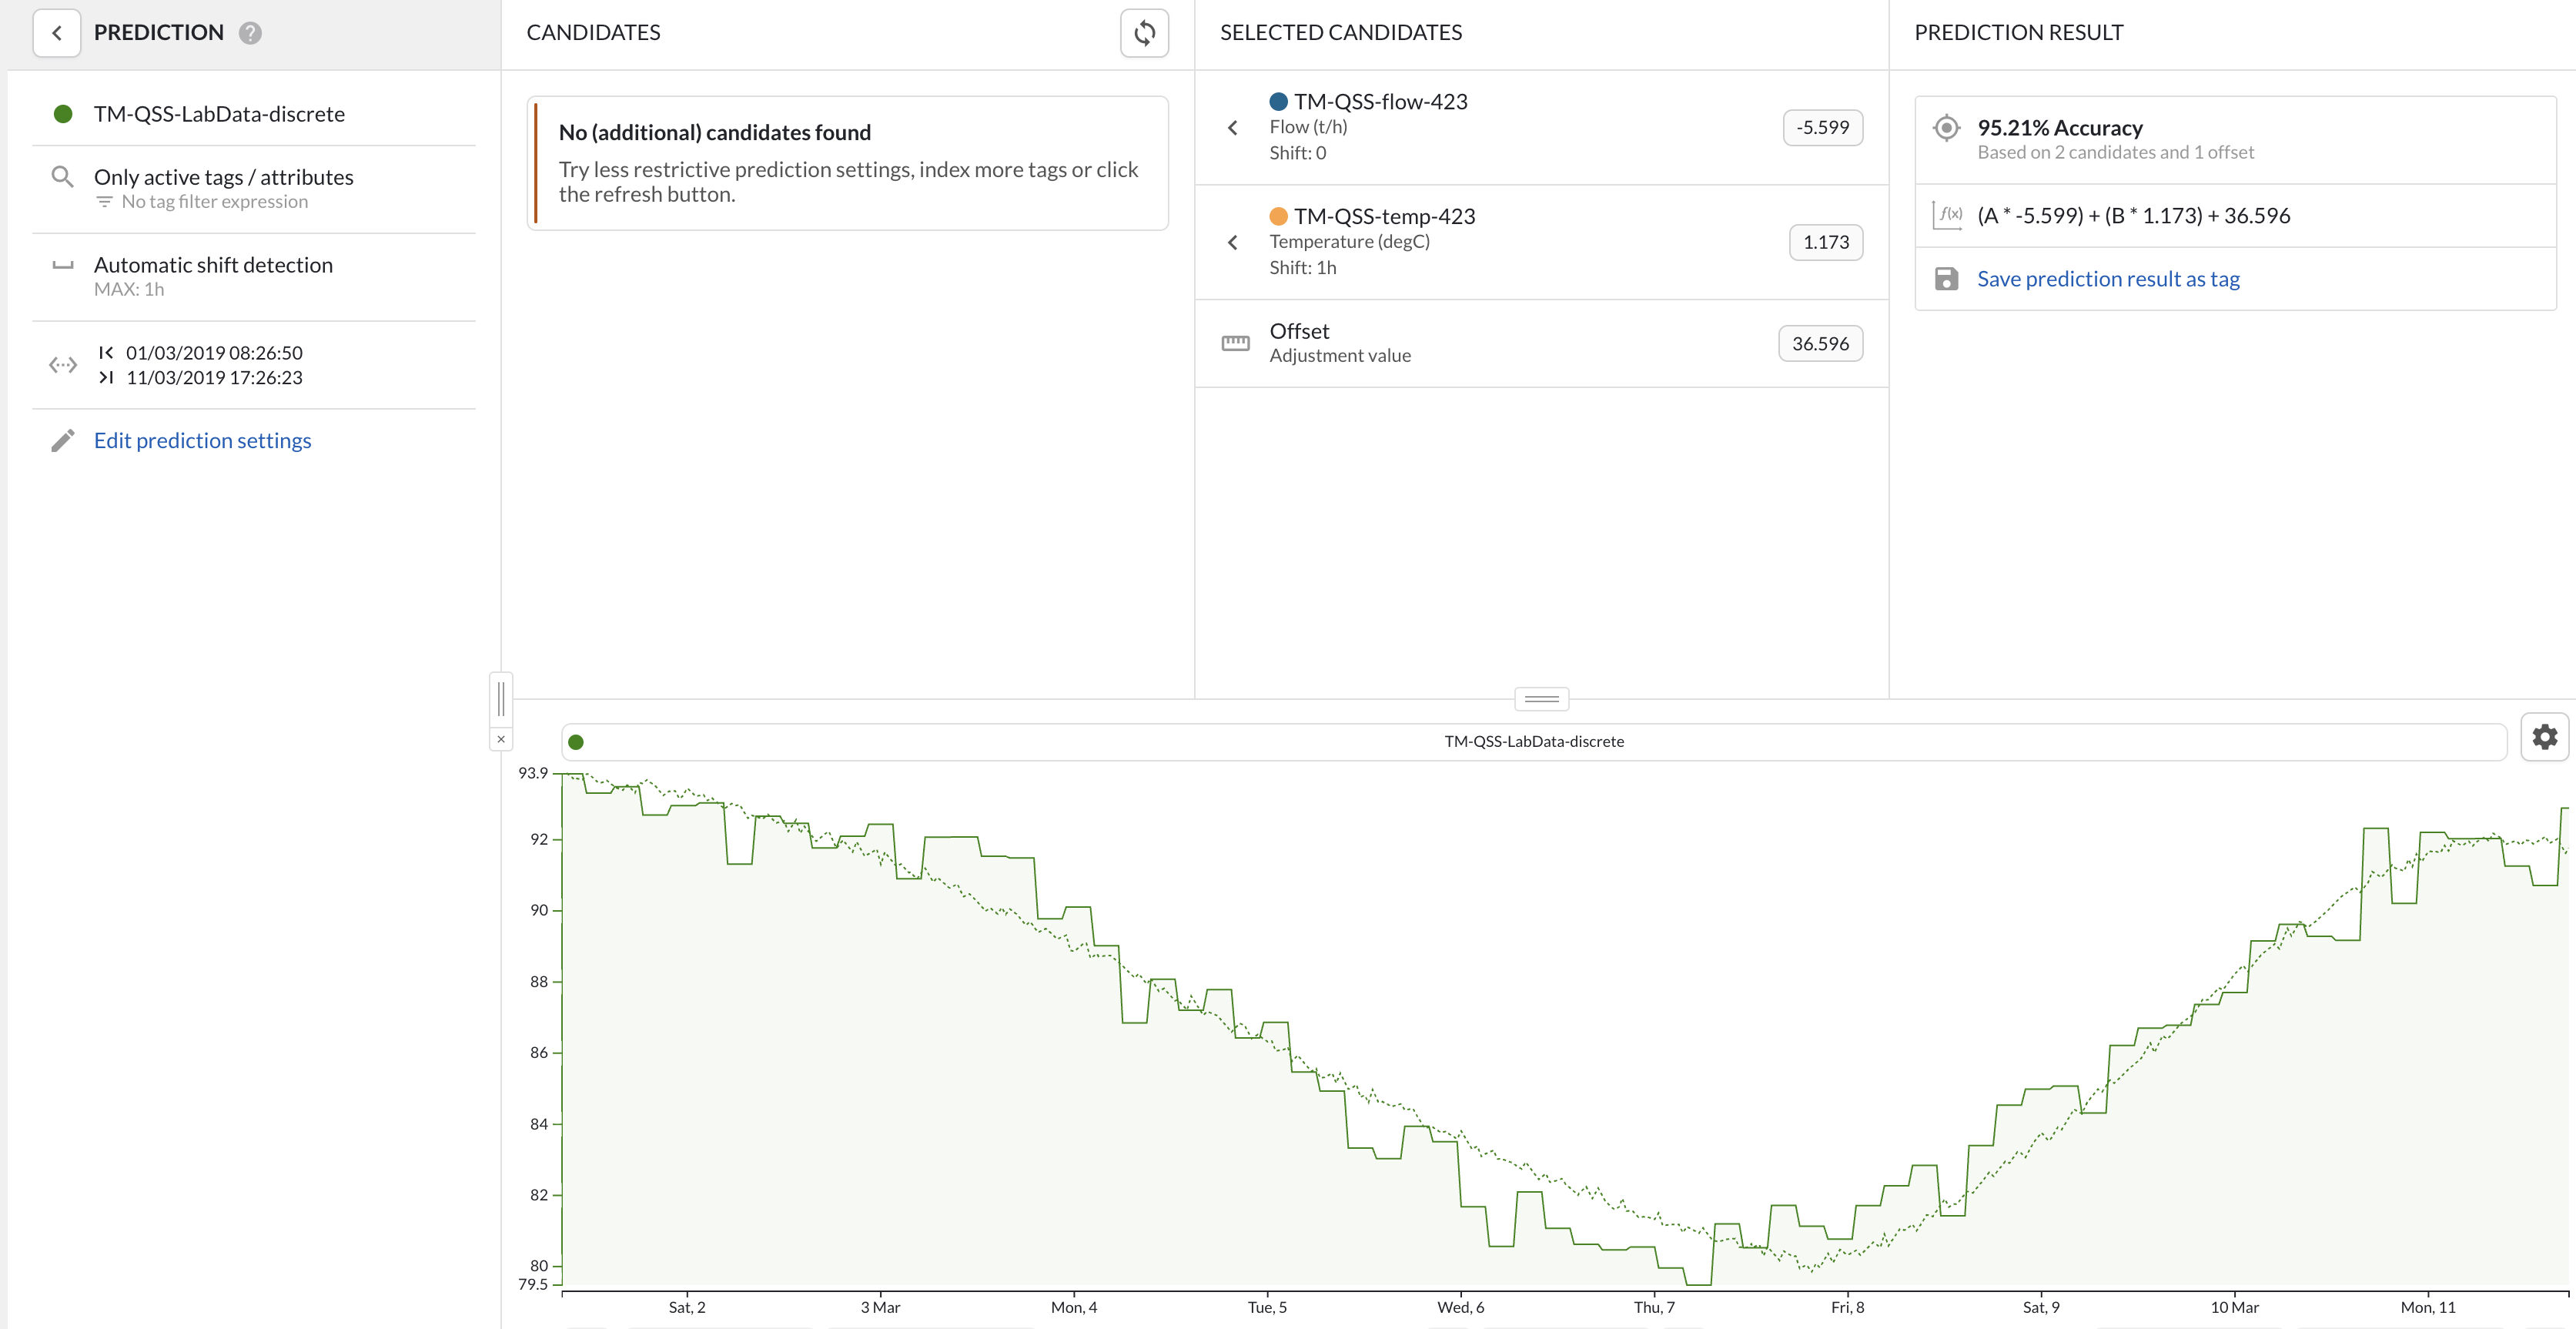
Ambient temperature showed a strong 87 percent correlation with vacuum pressure, while atmospheric pressure impact was significantly lower than assumed. Humidity proved to be a more influential variable than expected.
The Results
The Takeaway
By replacing assumptions with quantified correlations, the team gained clear insight into the real drivers of steam turbine performance, eliminated incorrect hypotheses, validated equipment health, and implemented proactive monitoring, strengthening asset reliability and operational confidence.
The Challenge
Steam turbine performance was believed to be strongly influenced by several meteorological parameters, particularly atmospheric pressure. Operators also suspected that fan behavior and vacuum pressure variations could indicate hidden performance issues.
However, these assumptions had never been rigorously quantified. Without clear correlation analysis, it was difficult to determine which external factors truly affected turbine efficiency and whether anomalies were present in the system.
- Uncertainty about impact of ambient conditions on turbine performance
- Assumptions regarding atmospheric pressure influence
- Need to quantify relationship between vacuum pressure and environmental variables
- Requirement to detect possible anomalies in fan operation
The Approach
The team conducted a structured correlation and monitoring study using advanced visualization and influence analysis tools.
- Scatter plot analysis, correlations between meteorological variables and turbine parameters were visualized and explored
- Influence factor quantification, statistical tools were used to measure the strength of linear relationships
- Hypothesis testing, assumed drivers such as atmospheric pressure were evaluated against actual data
- Performance validation, historical analysis over two years verified fan stability
- Monitoring implementation, a monitor was activated to detect and notify if abnormal fan behavior occurs
Key Insight
Ambient temperature showed a strong 87 percent correlation with vacuum pressure, while atmospheric pressure impact was significantly lower than assumed. Humidity proved to be a more influential variable than expected.
The Results
The Takeaway
By replacing assumptions with quantified correlations, the team gained clear insight into the real drivers of steam turbine performance, eliminated incorrect hypotheses, validated equipment health, and implemented proactive monitoring, strengthening asset reliability and operational confidence.
Access now
Share with a co-worker
The Challenge
Steam turbine performance was believed to be strongly influenced by several meteorological parameters, particularly atmospheric pressure. Operators also suspected that fan behavior and vacuum pressure variations could indicate hidden performance issues.
However, these assumptions had never been rigorously quantified. Without clear correlation analysis, it was difficult to determine which external factors truly affected turbine efficiency and whether anomalies were present in the system.
- Uncertainty about impact of ambient conditions on turbine performance
- Assumptions regarding atmospheric pressure influence
- Need to quantify relationship between vacuum pressure and environmental variables
- Requirement to detect possible anomalies in fan operation
The Approach
The team conducted a structured correlation and monitoring study using advanced visualization and influence analysis tools.
- Scatter plot analysis, correlations between meteorological variables and turbine parameters were visualized and explored
- Influence factor quantification, statistical tools were used to measure the strength of linear relationships
- Hypothesis testing, assumed drivers such as atmospheric pressure were evaluated against actual data
- Performance validation, historical analysis over two years verified fan stability
- Monitoring implementation, a monitor was activated to detect and notify if abnormal fan behavior occurs
Key Insight
Ambient temperature showed a strong 87 percent correlation with vacuum pressure, while atmospheric pressure impact was significantly lower than assumed. Humidity proved to be a more influential variable than expected.
The Results
The Takeaway
By replacing assumptions with quantified correlations, the team gained clear insight into the real drivers of steam turbine performance, eliminated incorrect hypotheses, validated equipment health, and implemented proactive monitoring, strengthening asset reliability and operational confidence.
Access now
Subscribe to our newsletter
Stay up to date with our latest news and updates.
Webinars on Demand
Press Play on Operational Improvement
.jpg)
.jpg)
.jpg)
Other Resources
Explore Our Newest Content to Maximize Your Operational Efficiency