The Hidden Performance Gap in Renewable Energy
Why the next opportunity for solar, wind and hydroelectric operators may already be buried in their operational data
A renewable portfolio can have a good day on paper and still leave performance on the table.
Generation may be close to target. Availability may look healthy. No critical alarms may have reached management. Yet across the portfolio, individual assets may have spent hours behaving differently from expected. A wind turbine may have underperformed its peers, a solar asset may have produced below its available potential, or a hydro unit may have operated under conditions worth investigating.
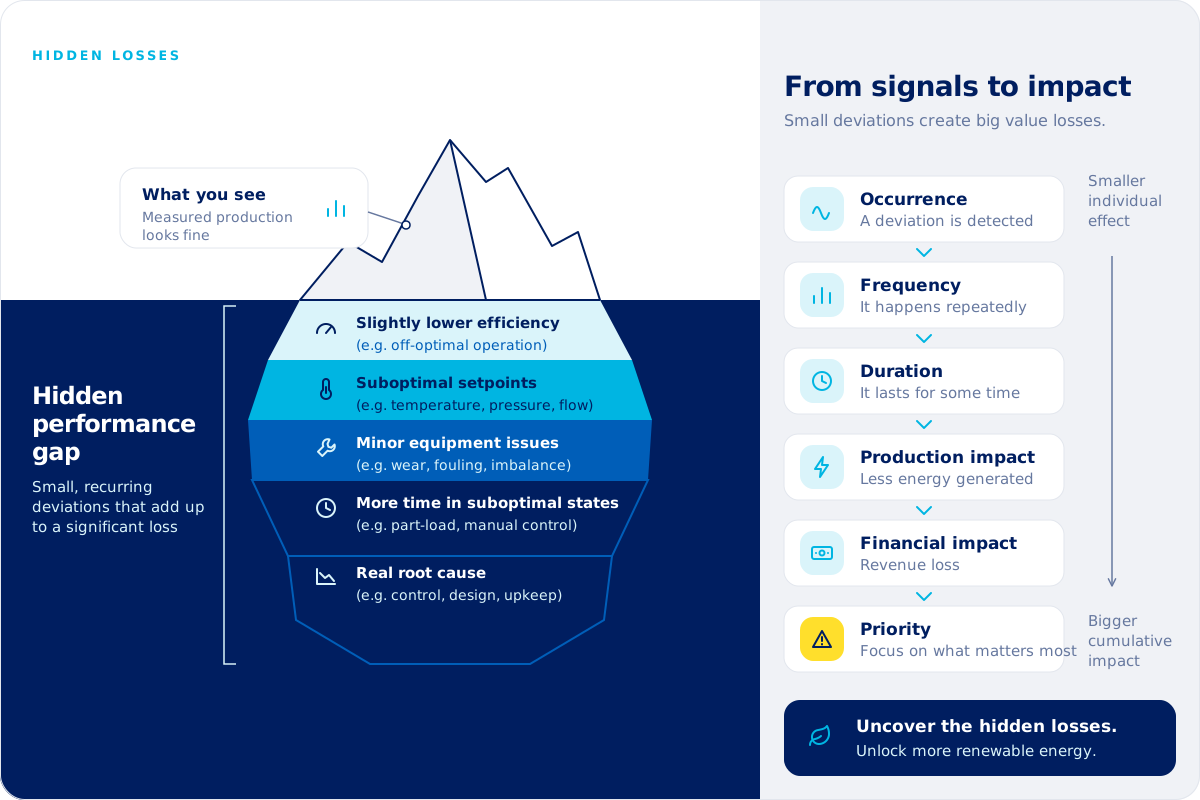
None of these events necessarily represents a major failure. Individually, some may barely move a monthly KPI. But repeated across hundreds of assets and thousands of operating hours, small performance gaps can become material.
This is becoming one of the defining challenges of renewable and power generation operations. The industry has unprecedented visibility into its assets. The next opportunity is not simply collecting more data, but finding the performance opportunities already hidden inside it.
The Renewable Performance Challenge Has Changed
The first wave of digitalization in power generation was largely about visibility. Operators needed reliable data from distributed assets, centralized monitoring and better ways to understand what was happening in the field.
Much of that infrastructure now exists. SCADA systems provide real-time visibility, historians contain years of process data, and monitoring platforms track production and availability.
As renewable portfolios expand, however, the challenge changes. Solar plants generate thousands of signals across equipment and environmental conditions. Wind farms continuously capture turbine, control and weather variables. Hydropower adds generation equipment, water conditions and complex operating requirements.
At portfolio scale, the volume becomes enormous.
The problem is no longer "Do we have the data?" It is increasingly "Can we find what matters inside it?"
A dashboard can show that production was below target. An alarm can identify when a predefined threshold has been exceeded. But neither necessarily explains which recurring behaviors contributed most to lost performance.
The Biggest Losses Don't Always Trigger the Biggest Alarms
When a major component fails, the organization responds. The event is visible, production impact is obvious and engineering resources are mobilized.
Smaller performance gaps behave differently. An asset may remain available while producing slightly below its potential. Equipment behavior may drift without exceeding alarm limits. Comparable assets may respond differently under similar conditions. An inefficient operating condition may appear for a few hours, disappear and return days later.
None of these events looks particularly urgent in isolation. But renewable performance is cumulative.
A relatively small production gap repeated hundreds of times can ultimately matter more than a highly visible one-off event. Understanding that impact requires moving beyond individual alarms and asking broader questions: How frequently does this happen? How long does it last? Where does it occur? Has the pattern changed? What does it mean for production?
Those answers often already exist somewhere in the historical operational data.
One Asset Is an Engineering Problem. 500 Assets Are a Data Problem.
Imagine a wind engineer notices unusual behavior on one turbine. They know the equipment, understand the process and know which signals to investigate. Given enough time, they will probably find an explanation.
Now change the question: Has the same behavior occurred on other turbines? How often? Under similar environmental conditions? Which turbines show it most frequently? Has the pattern increased over the last year?
The engineering problem has suddenly become a data problem.
The same challenge exists in solar and hydro. An analysis performed on one inverter, turbine or generating unit becomes significantly more valuable if the same logic can be applied across comparable equipment across the fleet.
As portfolios grow, engineering resources do not increase at the same rate as operational data. Subject-matter experts cannot manually investigate every potentially interesting deviation across every asset.
The real opportunity is therefore not only helping an engineer solve one problem faster. It is scaling that engineer's analytical knowledge across the portfolio.
From "Something Looks Wrong" to "This Is What It Costs Us"
Finding a pattern is only the beginning. For decision makers, the most useful analytics create a connection between technical behavior and operational impact.
The progression is relatively simple:
Occurrence → Frequency → Duration → Production impact → Financial impact → Priority
Historical analysis can reveal how often an undesirable condition occurs and how long it lasts. Combining that information with operational calculations can then quantify the associated production or consumption impact.
Once impact becomes measurable, prioritization changes. Instead of allocating engineering resources primarily to the most visible issue, organizations can compare opportunities based on their cumulative effect.
This becomes particularly powerful at portfolio scale. A small performance improvement on one asset may have limited financial significance. The same improvement applied across dozens or hundreds of comparable assets can tell a very different story.
For renewable operators under pressure to maximize production from existing infrastructure, finding and quantifying these repeatable opportunities can be as important as identifying major individual failures.
AI Is Changing How Operational Data Gets Used
Historically, extracting these insights from industrial time-series data has required a structured analytical process. Someone needs to select the relevant variables, define periods of interest, compare trends, create calculations and interpret the results.
That process works, but it places a practical limit on how many questions an organization can investigate.
AI-powered industrial analytics can change that interaction. Instead of translating every operational question into a series of manual analytical steps, AI can help users work from the question itself: compare similar assets, summarize recurring events, identify periods matching particular conditions or determine which equipment contributed most to a performance gap.
The important part is not that AI can generate another chart. It is that AI can reduce the friction between domain expertise and operational data.
The people who understand renewable assets best are engineers, reliability specialists, performance teams and operators. They know what good and bad behavior looks like.
The real promise of AI in renewable operations is not replacing that expertise. It is allowing that expertise to interrogate years of operational data faster and at a much larger scale.
Turn One Good Analysis Into a Repeatable Advantage
Suppose an engineer identifies a recurring performance issue and develops a reliable way to detect it. If that analysis has to be manually recreated every month, its organizational value remains limited.
Now imagine that the analytical logic can be reused. New occurrences can be detected, results monitored over time, and the same approach applied to similar equipment.
This is where industrial analytics starts to become a mechanism for scaling operational knowledge.
A methodology developed at one solar plant may be relevant elsewhere. A behavioral pattern identified on one wind turbine may be worth searching for across the fleet. An analysis created by a hydro specialist may become part of recurring performance monitoring.
AI adds another dimension by making that accumulated analytical knowledge easier to access and interrogate. Instead of producing more isolated analyses, organizations can build a repeatable process for finding, quantifying and acting on operational opportunities.
Different Technologies, the Same Performance Opportunity
Solar, wind and hydropower are very different technologies, but they share one important characteristic: every asset continuously creates a detailed historical record of how it behaves.
That history contains far more information than eventually appears in a monthly performance report. It can reveal repeated underperformance, differences between comparable equipment, unusual operating patterns and changing asset behavior.
The same thinking can extend to flexible generation. As renewable penetration grows, combined-cycle plants increasingly operate under dynamic conditions where understanding the cost and performance of individual operating events becomes more important.
Across these technologies, the analytical principle remains consistent:
Find the behavior. Understand its context. Quantify its impact. Determine whether it repeats. Scale the insight where it matters.
Turning Existing Data Into a Performance Asset
For most renewable operators, much of the data required to do this already exists. The opportunity is making it easier for operational experts to explore and turning successful investigations into repeatable ways of working.
This is where platforms such as TrendMiner are evolving the role of industrial analytics. As an AI-powered industrial analytics platform, TrendMiner enables engineers and operational experts to search and analyze time-series data, contextualize relevant events, quantify their impact and monitor insights without requiring a dedicated data-science project for every operational question.
TrendMiner Agent adds conversational AI to that workflow, helping users interact with analyses through natural language, generate aggregations and visualizations, and extract conclusions from operational data. Routines help turn valuable analyses into repeatable workflows across assets and over time.
The objective is not more analytics for the sake of analytics. It is to make the operational knowledge already present inside renewable organizations faster to apply and easier to scale.
As renewable portfolios continue to grow, the question for decision makers is no longer simply how much operational data their organization collects.
It is how much performance value they can extract from it.
And in many cases, the next opportunity may already be sitting in the historian, waiting to be found.
See It in Practice
See how these principles translate into real power generation applications:
- Solar PV: Quantifying energy and revenue losses from solar PV derating.
- Hydropower: Real-time detection and reporting of hydropower generation events.
- Wind: Monitoring the relationship between wind speed and power generation.
- Combined cycle: Characterizing turbine startups to quantify operational impact and consumption.