Share with a co-worker


The Challenge
Solar PV equipment can operate below its expected generation capacity due to derating events. While these events can be observed, their cumulative impact on energy production and revenue is difficult to quantify.
Without systematic tracking, teams lacked visibility into how much generation opportunity was being lost and its potential financial impact.
- Recurring derating events
- Lost generation difficult to quantify
- No consolidated historical view
- Financial impact not directly visible
- Potential losses increase significantly with plant size
The Approach
Engineers used TrendMiner search, calculation and AI capabilities to detect derating events, quantify their impact and scale the analysis.
Value-based searches: Operating conditions were used to automatically identify derating periods
Calculations on search results: Each event was enriched with its associated lost energy
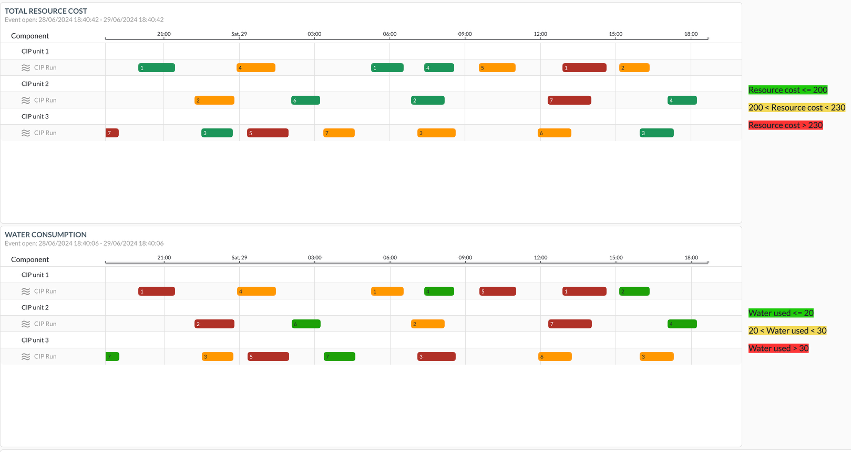
Event visualization: A Gantt chart provided a historical overview of derating events and their impact
Scalable loss analysis: TrendMiner Agent and Routines extended the analysis across equipment, automatically aggregating losses and generating charts and conclusions on total production impact
Key Insight
Translating derating events into energy and monetary losses made their business impact directly measurable and scalable across assets.
Results
Value
TrendMiner turns derating into a measurable and scalable business impact, combining automated event detection, loss calculations, Routines and AI-driven analysis to identify where recovery efforts should be prioritized. For an illustrative 10 MWp plant, derating could represent approximately $64,000/year in potential lost revenue, making hidden production losses visible, quantifiable and actionable across the asset fleet.
The Challenge
Solar PV equipment can operate below its expected generation capacity due to derating events. While these events can be observed, their cumulative impact on energy production and revenue is difficult to quantify.
Without systematic tracking, teams lacked visibility into how much generation opportunity was being lost and its potential financial impact.
- Recurring derating events
- Lost generation difficult to quantify
- No consolidated historical view
- Financial impact not directly visible
- Potential losses increase significantly with plant size
The Approach
Engineers used TrendMiner search, calculation and AI capabilities to detect derating events, quantify their impact and scale the analysis.
Value-based searches: Operating conditions were used to automatically identify derating periods
Calculations on search results: Each event was enriched with its associated lost energy
Event visualization: A Gantt chart provided a historical overview of derating events and their impact
Scalable loss analysis: TrendMiner Agent and Routines extended the analysis across equipment, automatically aggregating losses and generating charts and conclusions on total production impact
Key Insight
Translating derating events into energy and monetary losses made their business impact directly measurable and scalable across assets.
Results
Value
TrendMiner turns derating into a measurable and scalable business impact, combining automated event detection, loss calculations, Routines and AI-driven analysis to identify where recovery efforts should be prioritized. For an illustrative 10 MWp plant, derating could represent approximately $64,000/year in potential lost revenue, making hidden production losses visible, quantifiable and actionable across the asset fleet.
Access now
Share with a co-worker
The Challenge
Solar PV equipment can operate below its expected generation capacity due to derating events. While these events can be observed, their cumulative impact on energy production and revenue is difficult to quantify.
Without systematic tracking, teams lacked visibility into how much generation opportunity was being lost and its potential financial impact.
- Recurring derating events
- Lost generation difficult to quantify
- No consolidated historical view
- Financial impact not directly visible
- Potential losses increase significantly with plant size
The Approach
Engineers used TrendMiner search, calculation and AI capabilities to detect derating events, quantify their impact and scale the analysis.
Value-based searches: Operating conditions were used to automatically identify derating periods
Calculations on search results: Each event was enriched with its associated lost energy
Event visualization: A Gantt chart provided a historical overview of derating events and their impact
Scalable loss analysis: TrendMiner Agent and Routines extended the analysis across equipment, automatically aggregating losses and generating charts and conclusions on total production impact
Key Insight
Translating derating events into energy and monetary losses made their business impact directly measurable and scalable across assets.
Results
Value
TrendMiner turns derating into a measurable and scalable business impact, combining automated event detection, loss calculations, Routines and AI-driven analysis to identify where recovery efforts should be prioritized. For an illustrative 10 MWp plant, derating could represent approximately $64,000/year in potential lost revenue, making hidden production losses visible, quantifiable and actionable across the asset fleet.
Access now
Subscribe to our newsletter
Stay up to date with our latest news and updates.
Webinars on Demand
Press Play on Operational Improvement
.jpeg)
.jpeg)
.jpeg)
Other Resources
Explore Our Newest Content to Maximize Your Operational Efficiency