Share with a co-worker

Early Detection of Losses and Performance Improvement in Biomass Boiler Feeding
The Challenge
During the cocoa husk separation process, excessive suction was occasionally pulling in the internal part of the bean ("grue") along with the husk. This led to:
- Loss of valuable raw material needed for chocolate production
- Difficulty detecting when grue was being carried into the biomass boiler
- Lack of visibility on how much husk was being fed per shift
The Approach
The team implemented smart monitoring using Value-Based Searches to identify abnormal shifts and improve process understanding:
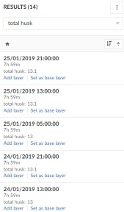
- Calculated husk volume per shift to establish a normal operating pattern by filtering operational periods and using the statistics table to determine total volumes.
- Flagged shifts with higher-than-expected husk volumes—a potential indication that grue might be carried over—through the real-time monitoring system.
- Linked the monitoring setup to automated email alerts, enabling the control team to respond immediately and adjust suction parameters as needed.
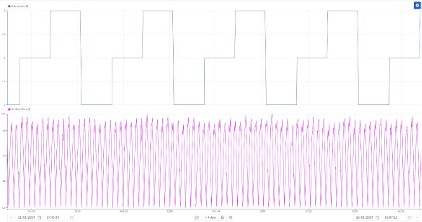
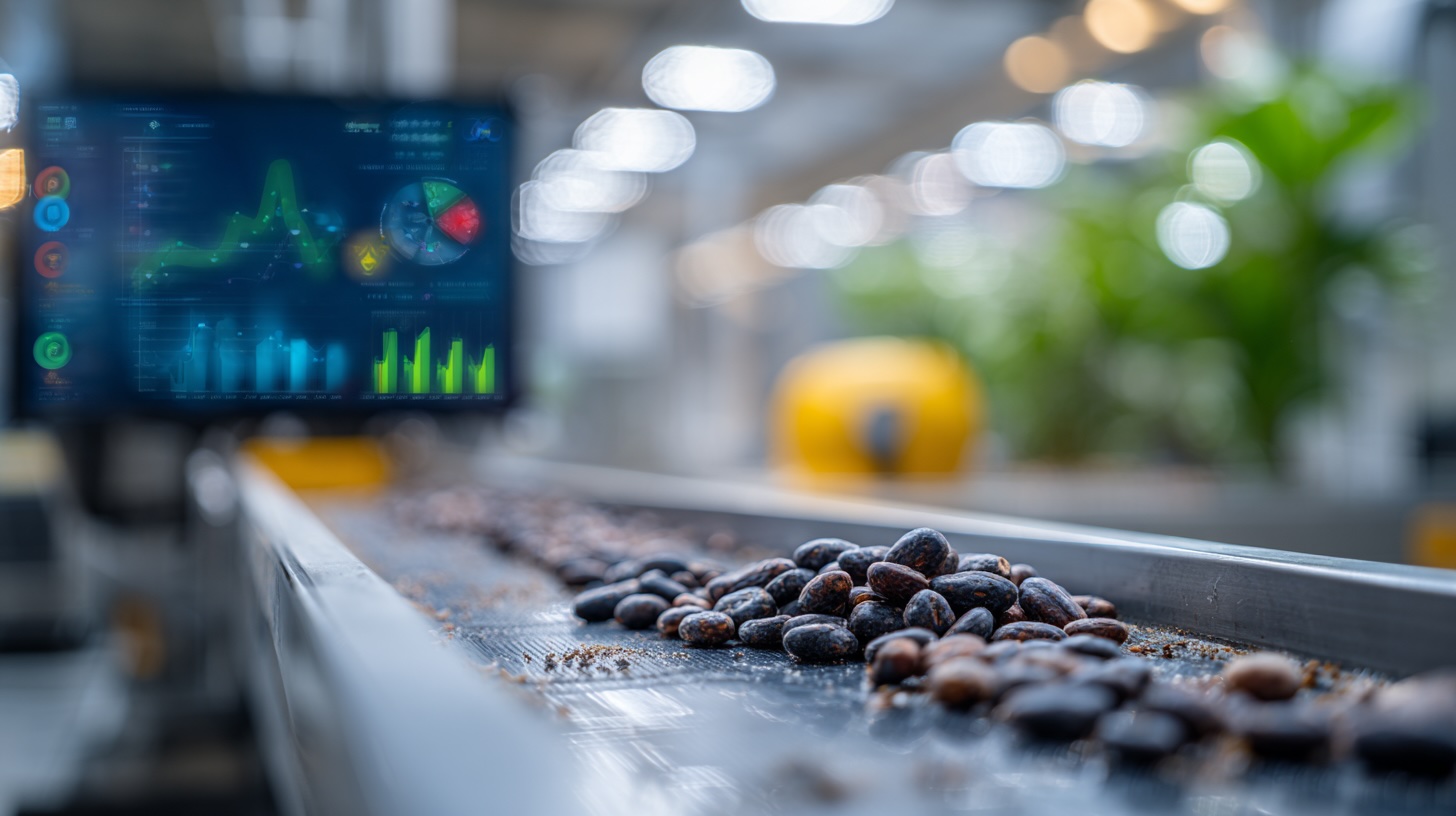
Shift and husk feed trends & total husk calculated per shift
The Results
The Takeaway
By moving from reactive checks to data-driven condition monitoring, the plant gained visibility into a hidden source of raw material loss and took fast corrective action — without hardware changes.
Want to unlock similar efficiency gains using your process data? Let’s talk about what’s possible.
Early Detection of Losses and Performance Improvement in Biomass Boiler Feeding
The Challenge
During the cocoa husk separation process, excessive suction was occasionally pulling in the internal part of the bean ("grue") along with the husk. This led to:
- Loss of valuable raw material needed for chocolate production
- Difficulty detecting when grue was being carried into the biomass boiler
- Lack of visibility on how much husk was being fed per shift
The Approach
The team implemented smart monitoring using Value-Based Searches to identify abnormal shifts and improve process understanding:
- Calculated husk volume per shift to establish a normal operating pattern by filtering operational periods and using the statistics table to determine total volumes.
- Flagged shifts with higher-than-expected husk volumes—a potential indication that grue might be carried over—through the real-time monitoring system.
- Linked the monitoring setup to automated email alerts, enabling the control team to respond immediately and adjust suction parameters as needed.
Shift and husk feed trends & total husk calculated per shift
The Results
The Takeaway
By moving from reactive checks to data-driven condition monitoring, the plant gained visibility into a hidden source of raw material loss and took fast corrective action — without hardware changes.
Want to unlock similar efficiency gains using your process data? Let’s talk about what’s possible.
Access now
Share with a co-worker
Early Detection of Losses and Performance Improvement in Biomass Boiler Feeding
The Challenge
During the cocoa husk separation process, excessive suction was occasionally pulling in the internal part of the bean ("grue") along with the husk. This led to:
- Loss of valuable raw material needed for chocolate production
- Difficulty detecting when grue was being carried into the biomass boiler
- Lack of visibility on how much husk was being fed per shift
The Approach
The team implemented smart monitoring using Value-Based Searches to identify abnormal shifts and improve process understanding:
- Calculated husk volume per shift to establish a normal operating pattern by filtering operational periods and using the statistics table to determine total volumes.
- Flagged shifts with higher-than-expected husk volumes—a potential indication that grue might be carried over—through the real-time monitoring system.
- Linked the monitoring setup to automated email alerts, enabling the control team to respond immediately and adjust suction parameters as needed.
Shift and husk feed trends & total husk calculated per shift
The Results
The Takeaway
By moving from reactive checks to data-driven condition monitoring, the plant gained visibility into a hidden source of raw material loss and took fast corrective action — without hardware changes.
Want to unlock similar efficiency gains using your process data? Let’s talk about what’s possible.
Access now
Subscribe to our newsletter
Stay up to date with our latest news and updates.
Webinars on Demand
Press Play on Operational Improvement

.jpg)
Other Resources
Explore Our Newest Content to Maximize Your Operational Efficiency