Share with a co-worker

Blade Sharpness Directly Impacts Cutting Quality
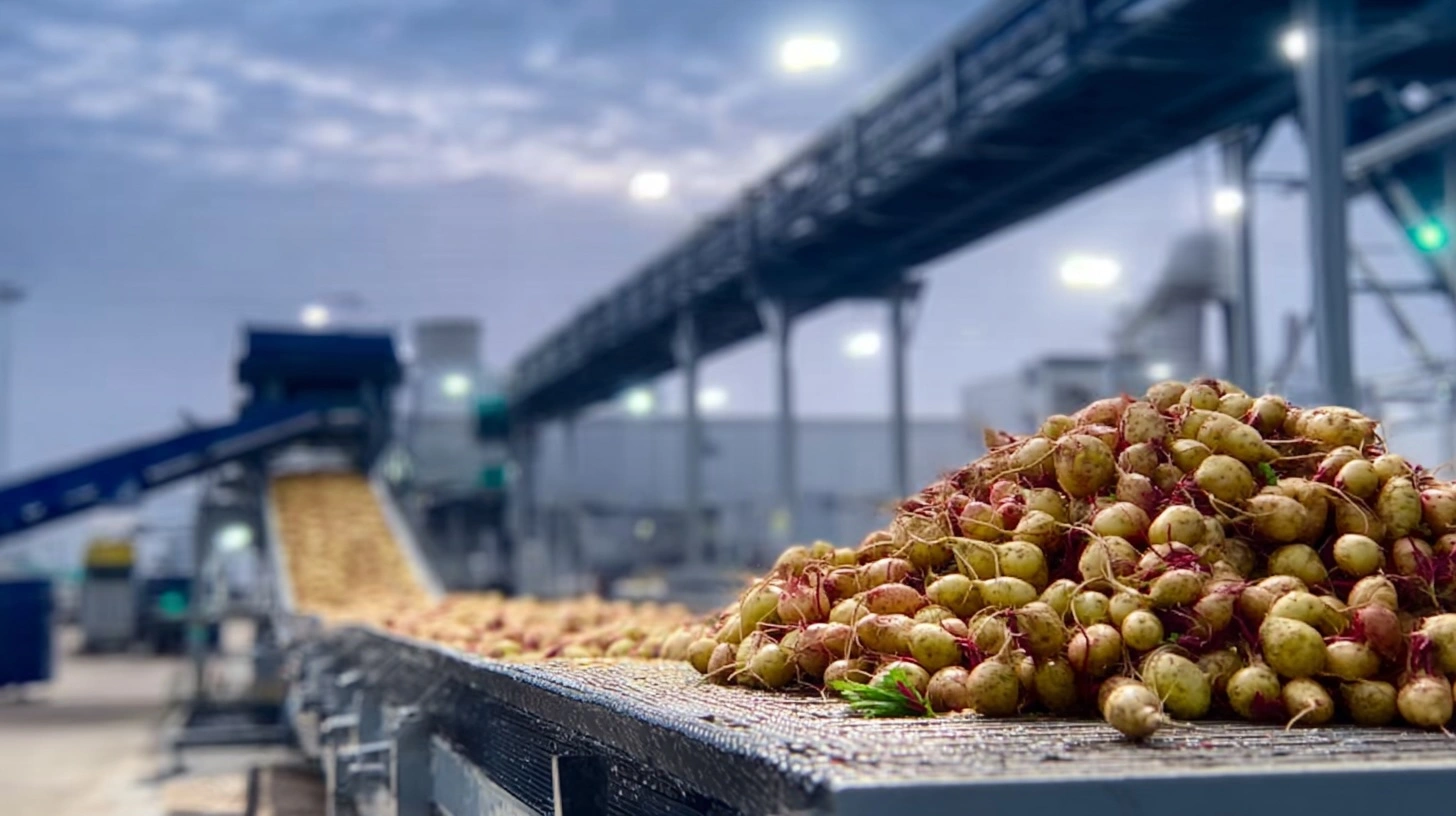
Several beet cutting mills feed one tower. Blades are swapped continuously during the campaign due to dullness. End dullness is measured per run (0–100 scale), with data logged in TrendMiner. Sharp blades result in high-quality cuttings, whereas dull blades can lead to clogging and poor performance.
The Approach
- Cycle Duration Analysis: Cycle duration for each mill was determined using value-based searches, with results exported or blade dullness data imported to TrendMiner for event analytics.
- Uptime vs. Dullness Correlation: Uptime was correlated to laboratory-measured blade dullness by combining exported cycle data with dullness values and analyzing trends.
- Cross-Mill Comparison: Average blade dullness and run duration between mills were compared using value-based searches and calculated fields to generate reports.
- Clogging Investigation: Potential links between blade dullness and tower clogging indicators were explored using event data and search filters.
- Cutting Quality Visualization: Cutting quality versus pressure (a clogging indicator) was visualized by calculating averages and plotting scatter graphs within TrendMiner.

Insight
This approach provides actionable insights into mill performance, revealing correlations between blade condition, run duration, and clogging, while allowing for quick visual checks and data-driven process improvements.
Results
Takeaway
Real data revealed surprising behavior: the "best" mill may be overused, which hurts the cut quality. Visual monitoring allows for faster, data-backed blade replacements and improves process reliability.
Want to uncover hidden inefficiencies in your operations? Let’s talk.
Blade Sharpness Directly Impacts Cutting Quality
Several beet cutting mills feed one tower. Blades are swapped continuously during the campaign due to dullness. End dullness is measured per run (0–100 scale), with data logged in TrendMiner. Sharp blades result in high-quality cuttings, whereas dull blades can lead to clogging and poor performance.
The Approach
- Cycle Duration Analysis: Cycle duration for each mill was determined using value-based searches, with results exported or blade dullness data imported to TrendMiner for event analytics.
- Uptime vs. Dullness Correlation: Uptime was correlated to laboratory-measured blade dullness by combining exported cycle data with dullness values and analyzing trends.
- Cross-Mill Comparison: Average blade dullness and run duration between mills were compared using value-based searches and calculated fields to generate reports.
- Clogging Investigation: Potential links between blade dullness and tower clogging indicators were explored using event data and search filters.
- Cutting Quality Visualization: Cutting quality versus pressure (a clogging indicator) was visualized by calculating averages and plotting scatter graphs within TrendMiner.
Insight
This approach provides actionable insights into mill performance, revealing correlations between blade condition, run duration, and clogging, while allowing for quick visual checks and data-driven process improvements.
Results
Takeaway
Real data revealed surprising behavior: the "best" mill may be overused, which hurts the cut quality. Visual monitoring allows for faster, data-backed blade replacements and improves process reliability.
Want to uncover hidden inefficiencies in your operations? Let’s talk.
Access now
Share with a co-worker
Blade Sharpness Directly Impacts Cutting Quality
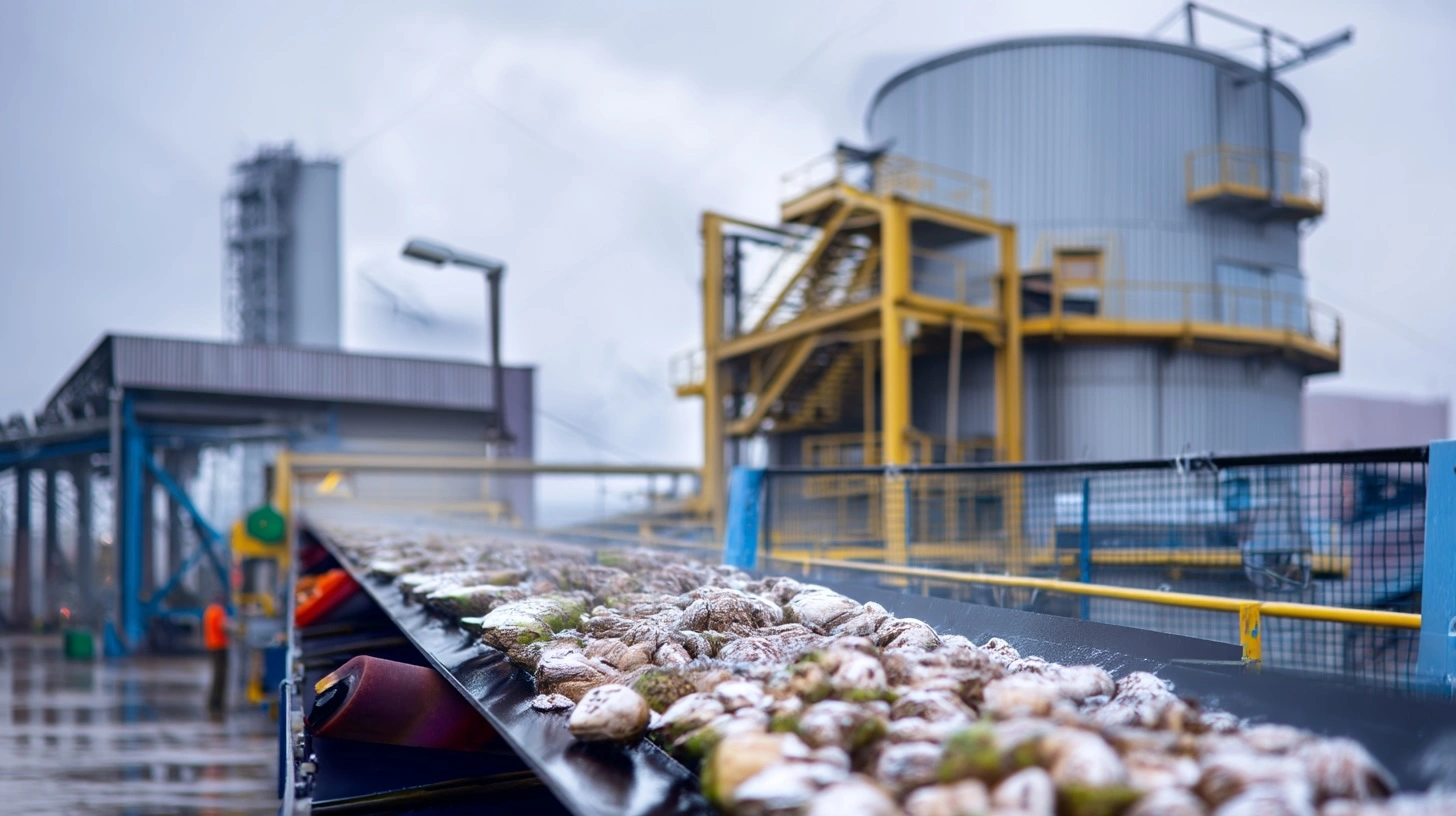
Several beet cutting mills feed one tower. Blades are swapped continuously during the campaign due to dullness. End dullness is measured per run (0–100 scale), with data logged in TrendMiner. Sharp blades result in high-quality cuttings, whereas dull blades can lead to clogging and poor performance.
The Approach
- Cycle Duration Analysis: Cycle duration for each mill was determined using value-based searches, with results exported or blade dullness data imported to TrendMiner for event analytics.
- Uptime vs. Dullness Correlation: Uptime was correlated to laboratory-measured blade dullness by combining exported cycle data with dullness values and analyzing trends.
- Cross-Mill Comparison: Average blade dullness and run duration between mills were compared using value-based searches and calculated fields to generate reports.
- Clogging Investigation: Potential links between blade dullness and tower clogging indicators were explored using event data and search filters.
- Cutting Quality Visualization: Cutting quality versus pressure (a clogging indicator) was visualized by calculating averages and plotting scatter graphs within TrendMiner.
Insight
This approach provides actionable insights into mill performance, revealing correlations between blade condition, run duration, and clogging, while allowing for quick visual checks and data-driven process improvements.
Results
Takeaway
Real data revealed surprising behavior: the "best" mill may be overused, which hurts the cut quality. Visual monitoring allows for faster, data-backed blade replacements and improves process reliability.
Want to uncover hidden inefficiencies in your operations? Let’s talk.
Access now
Subscribe to our newsletter
Stay up to date with our latest news and updates.
Webinars on Demand
Press Play on Operational Improvement
.jpg)
Other Resources
Explore Our Newest Content to Maximize Your Operational Efficiency