
Share with a co-worker

Dilution Done Right = Higher Revenue, Less Waste
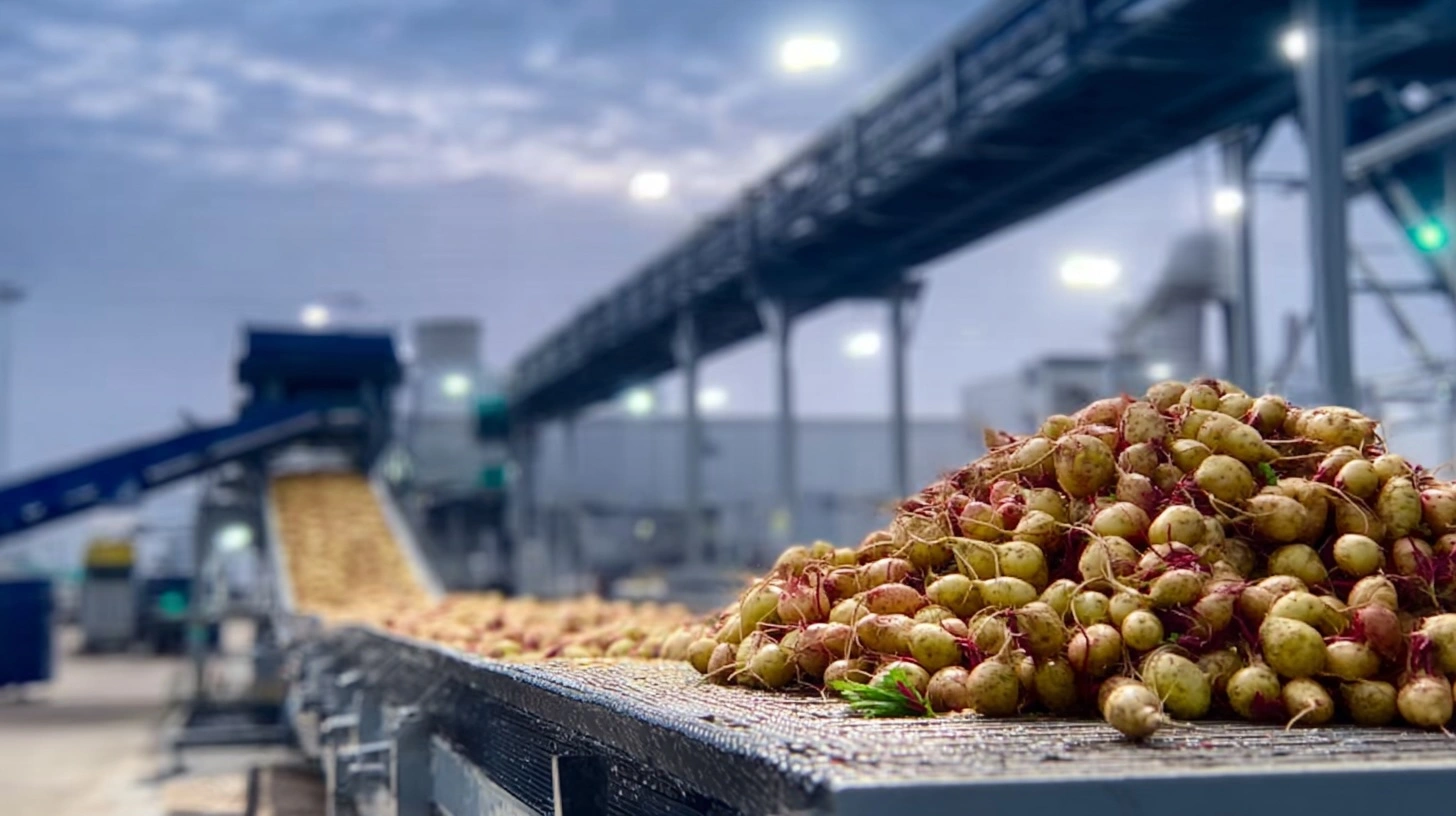
Beet pulp must reach a minimum of 26% dry mass. Between 26–28%, price increases with purity — but anything above 28% brings no added value. To maximize profit, excess purity should be diluted with water.
The Approach
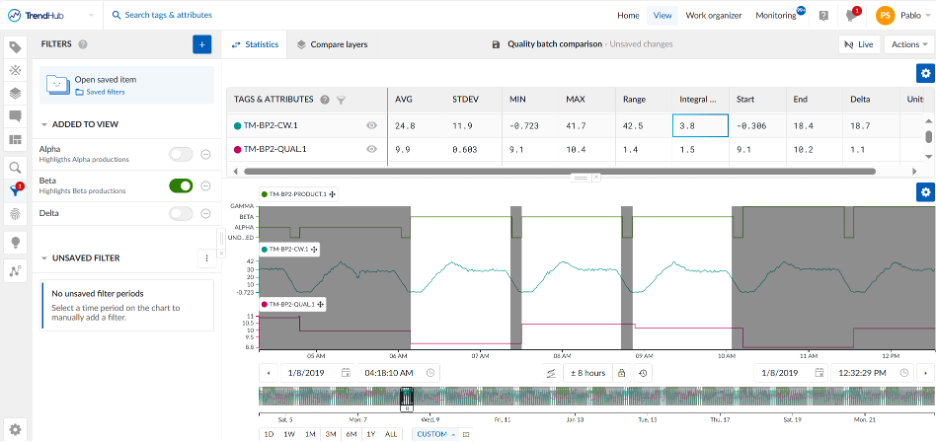
- Water Addition Tracking: calculated the total water added as “product” per campaign using integrals in the statistics table, with campaign filters to highlight each period.
- Dry Mass Ratio Measurement: computed average dry mass percentage only during active system operation, applying formulas to derive dry mass from live signals.
- DoubleCheck with Flow & Activity: cross-verified results by comparing flow integrals and pump activity filters against calculated reports for accuracy.
- Rapid Visualization: leveraged the statistics table and precreated filters for fast, repeatable checks and ad-hoc analysis of dry mass trends over specific time ranges.
Insight
This method provides precise, contextualized tracking of water addition and dry mass, enabling reliable monitoring and quick process evaluations.
Results
Takeaway
A once time-consuming report now takes minutes. Smart filtering and KPI tracking helped ensure product met quality targets — without over-delivering value. Want to turn hidden dilution data into real value? Let’s connect.
Dilution Done Right = Higher Revenue, Less Waste
Beet pulp must reach a minimum of 26% dry mass. Between 26–28%, price increases with purity — but anything above 28% brings no added value. To maximize profit, excess purity should be diluted with water.
The Approach
- Water Addition Tracking: calculated the total water added as “product” per campaign using integrals in the statistics table, with campaign filters to highlight each period.
- Dry Mass Ratio Measurement: computed average dry mass percentage only during active system operation, applying formulas to derive dry mass from live signals.
- DoubleCheck with Flow & Activity: cross-verified results by comparing flow integrals and pump activity filters against calculated reports for accuracy.
- Rapid Visualization: leveraged the statistics table and precreated filters for fast, repeatable checks and ad-hoc analysis of dry mass trends over specific time ranges.
Insight
This method provides precise, contextualized tracking of water addition and dry mass, enabling reliable monitoring and quick process evaluations.
Results
Takeaway
A once time-consuming report now takes minutes. Smart filtering and KPI tracking helped ensure product met quality targets — without over-delivering value. Want to turn hidden dilution data into real value? Let’s connect.
Access now
Share with a co-worker
Dilution Done Right = Higher Revenue, Less Waste
Beet pulp must reach a minimum of 26% dry mass. Between 26–28%, price increases with purity — but anything above 28% brings no added value. To maximize profit, excess purity should be diluted with water.
The Approach
- Water Addition Tracking: calculated the total water added as “product” per campaign using integrals in the statistics table, with campaign filters to highlight each period.
- Dry Mass Ratio Measurement: computed average dry mass percentage only during active system operation, applying formulas to derive dry mass from live signals.
- DoubleCheck with Flow & Activity: cross-verified results by comparing flow integrals and pump activity filters against calculated reports for accuracy.
- Rapid Visualization: leveraged the statistics table and precreated filters for fast, repeatable checks and ad-hoc analysis of dry mass trends over specific time ranges.
Insight
This method provides precise, contextualized tracking of water addition and dry mass, enabling reliable monitoring and quick process evaluations.
Results
Takeaway
A once time-consuming report now takes minutes. Smart filtering and KPI tracking helped ensure product met quality targets — without over-delivering value. Want to turn hidden dilution data into real value? Let’s connect.
Access now
Subscribe to our newsletter
Stay up to date with our latest news and updates.
Webinars on Demand
Press Play on Operational Improvement
.jpg)
Other Resources
Explore Our Newest Content to Maximize Your Operational Efficiency