Share with a co-worker

Two Factories, One Goal: Distillation Efficiency
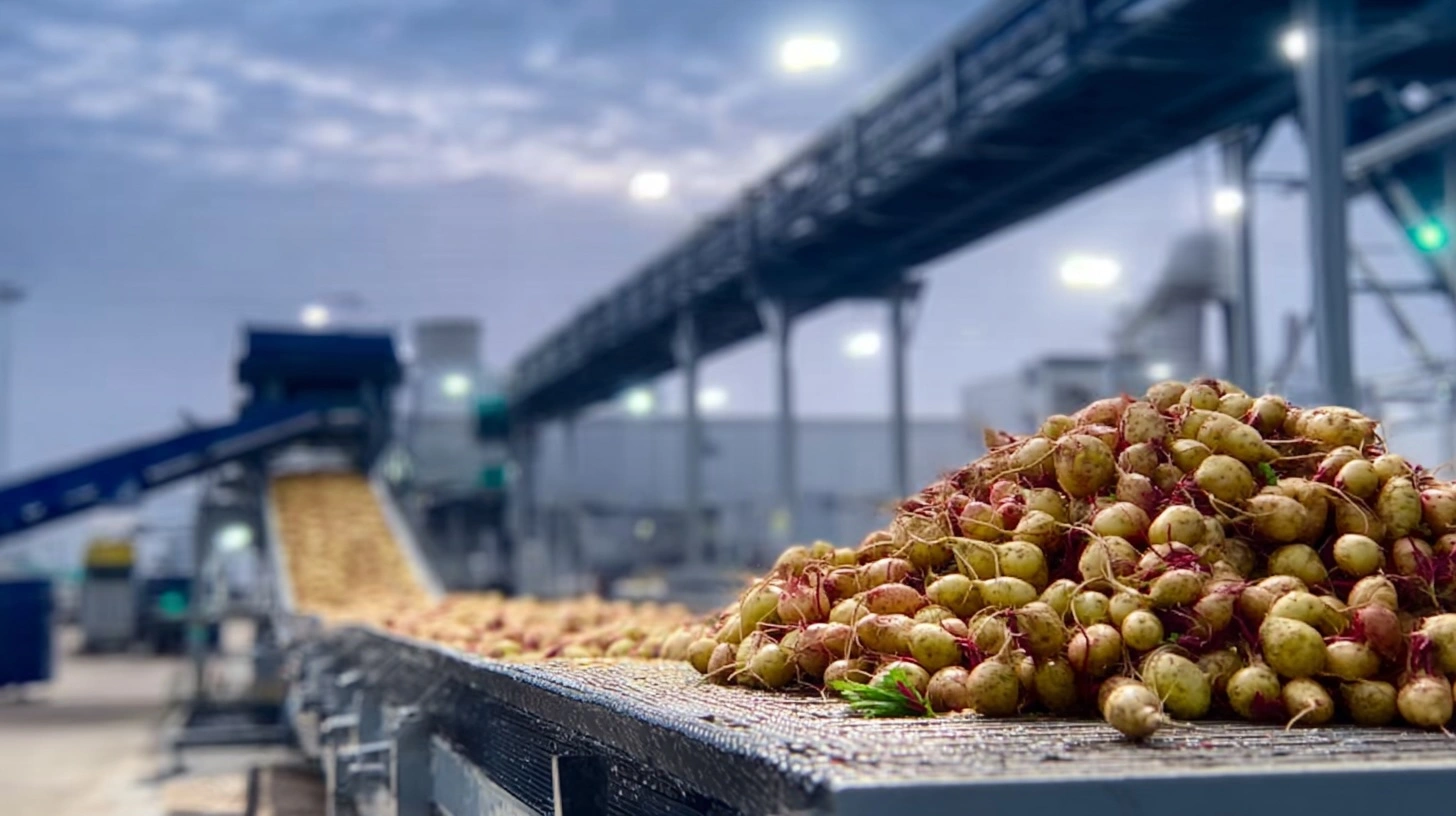
Thick juice (syrup) left after crystallization is used for alcohol production. After fermentation, the product enters 4 distillation columns — with one column always in regeneration mode. The goal: compare both sites on regeneration frequency and efficiency over time.
The Approach
The team built a dual-factory dashboard for:
- Flow & Cycle Visibility: visualized column flowrates, regeneration cycles (via ValueBased Searches), and detailed duration data for both factories.
- Event Contextualization: used counters to compare the number of regenerations by linking events captured with TrendMiner for clear context.
- Duration Analysis: tracked regeneration durations in tables and calculated averages to enable global benchmarking.
- Unified Timing View: displayed cycle timing with Gantt charts for each site—consolidated into a single, comprehensive dashboard.
Insight:
With these capabilities, you gain a unified, realtime overview of both factories’ regeneration performance, driving faster comparisons and more informed decisions.

Results
Takeaway
What used to take hours and manual effort is now automated and visual. The team gained better insight, faster — unlocking smarter, data-driven comparisons between sites. Looking to scale your process visibility across plants? Let’s talk.
Two Factories, One Goal: Distillation Efficiency
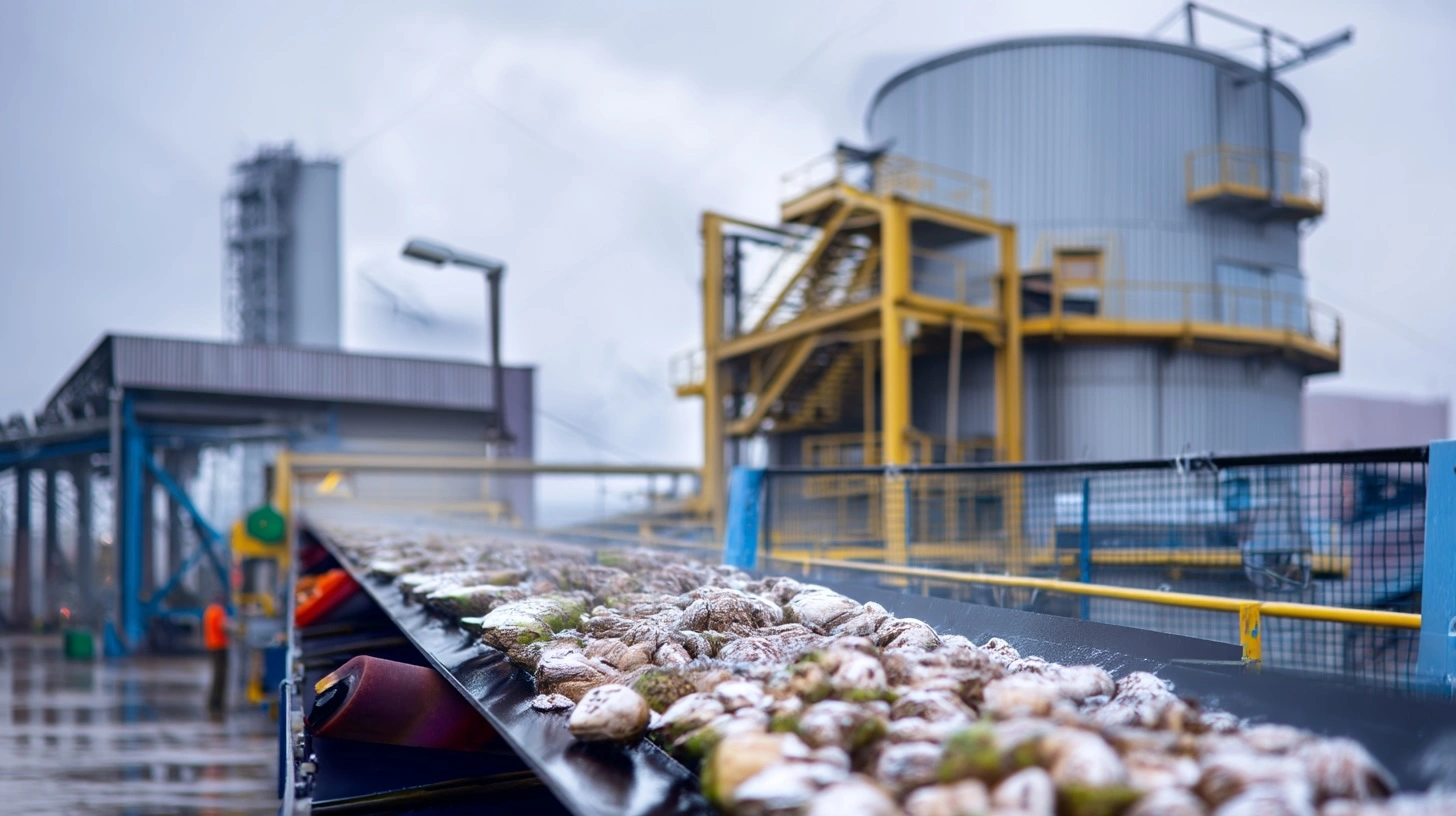
Thick juice (syrup) left after crystallization is used for alcohol production. After fermentation, the product enters 4 distillation columns — with one column always in regeneration mode. The goal: compare both sites on regeneration frequency and efficiency over time.
The Approach
The team built a dual-factory dashboard for:
- Flow & Cycle Visibility: visualized column flowrates, regeneration cycles (via ValueBased Searches), and detailed duration data for both factories.
- Event Contextualization: used counters to compare the number of regenerations by linking events captured with TrendMiner for clear context.
- Duration Analysis: tracked regeneration durations in tables and calculated averages to enable global benchmarking.
- Unified Timing View: displayed cycle timing with Gantt charts for each site—consolidated into a single, comprehensive dashboard.
Insight:
With these capabilities, you gain a unified, realtime overview of both factories’ regeneration performance, driving faster comparisons and more informed decisions.
Results
Takeaway
What used to take hours and manual effort is now automated and visual. The team gained better insight, faster — unlocking smarter, data-driven comparisons between sites. Looking to scale your process visibility across plants? Let’s talk.
Access now
Share with a co-worker
Two Factories, One Goal: Distillation Efficiency
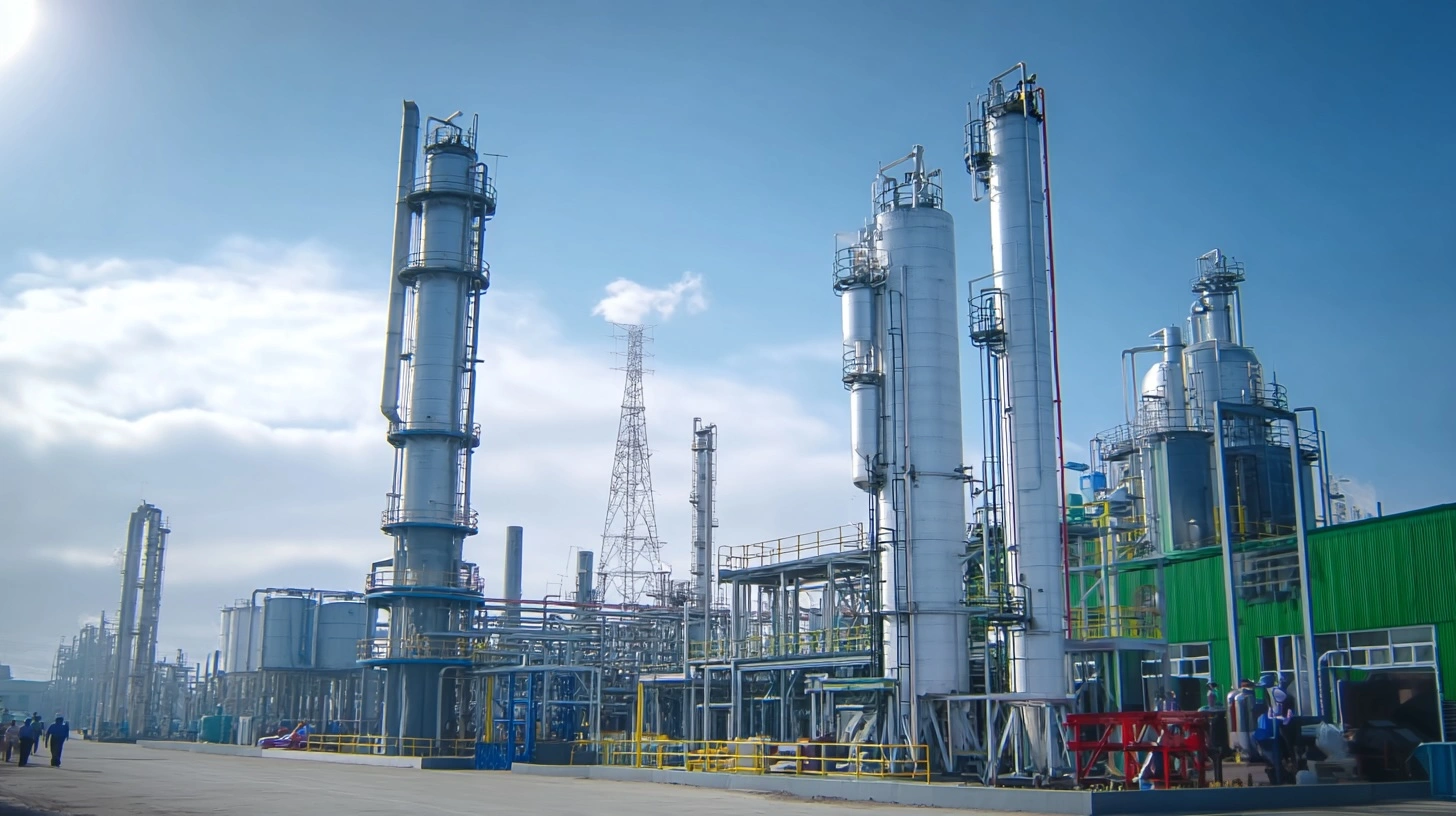
Thick juice (syrup) left after crystallization is used for alcohol production. After fermentation, the product enters 4 distillation columns — with one column always in regeneration mode. The goal: compare both sites on regeneration frequency and efficiency over time.
The Approach
The team built a dual-factory dashboard for:
- Flow & Cycle Visibility: visualized column flowrates, regeneration cycles (via ValueBased Searches), and detailed duration data for both factories.
- Event Contextualization: used counters to compare the number of regenerations by linking events captured with TrendMiner for clear context.
- Duration Analysis: tracked regeneration durations in tables and calculated averages to enable global benchmarking.
- Unified Timing View: displayed cycle timing with Gantt charts for each site—consolidated into a single, comprehensive dashboard.
Insight:
With these capabilities, you gain a unified, realtime overview of both factories’ regeneration performance, driving faster comparisons and more informed decisions.
Results
Takeaway
What used to take hours and manual effort is now automated and visual. The team gained better insight, faster — unlocking smarter, data-driven comparisons between sites. Looking to scale your process visibility across plants? Let’s talk.
Access now
Subscribe to our newsletter
Stay up to date with our latest news and updates.
Webinars on Demand
Press Play on Operational Improvement
.jpg)
Other Resources
Explore Our Newest Content to Maximize Your Operational Efficiency