Share with a co-worker
All Resources
Use case

The Challenge
The conching process is key to achieving the right texture and flavor in chocolate.
Given its sensitivity to time, temperature, and speed, manufacturers needed to:
- Build a unified view of ongoing batches and recipes
- Compare performance across batches
- Analyze Time Series Data for quality assurance and consistency
The Approach
To enable full traceability and real-time oversight, a structured, data-integrated solution was implemented:
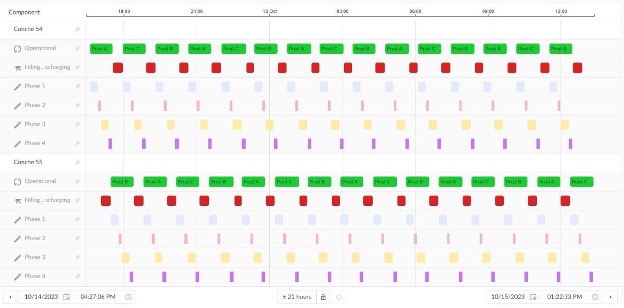
- Connected the SQL batch database to TrendMiner for Gantt Chart visualization
- Where direct access wasn’t possible, ValueBased Searches were created per recipe and asset to identify all relevant conching cycles within the data.
- These Value Based Search results were linked to contextual events, enabling automated tracking in the Gantt view.
Through this enhanced data layer, experts can now visually navigate cycles and interact with them—just one click away from jumping into the Time Series Data for deeper analysis.
Breakthrough: The Gantt dashboard provided teams with a shared, realtime view across all assets, instantly revealing inefficiencies and recipe deviations.
The Results
| KPI / Feature | Outcome |
|---|---|
| Batch Visibility | Unified live & historical Gantt view |
| Accessibility | Shared dashboards across teams |
| Batch Comparisons | Linked Time Series enabled insights |
| Quality Monitoring | Improved with contextual data |
The Takeaway
With real-time batch tracking and visual tools in place, the team improved process control, reduced manual tracking, and elevated chocolate quality.
Want live visibility into your batch processes? Let’s bring clarity to your production line.
The Challenge
The conching process is key to achieving the right texture and flavor in chocolate.
Given its sensitivity to time, temperature, and speed, manufacturers needed to:
- Build a unified view of ongoing batches and recipes
- Compare performance across batches
- Analyze Time Series Data for quality assurance and consistency
The Approach
To enable full traceability and real-time oversight, a structured, data-integrated solution was implemented:
- Connected the SQL batch database to TrendMiner for Gantt Chart visualization
- Where direct access wasn’t possible, ValueBased Searches were created per recipe and asset to identify all relevant conching cycles within the data.
- These Value Based Search results were linked to contextual events, enabling automated tracking in the Gantt view.
Through this enhanced data layer, experts can now visually navigate cycles and interact with them—just one click away from jumping into the Time Series Data for deeper analysis.
Breakthrough: The Gantt dashboard provided teams with a shared, realtime view across all assets, instantly revealing inefficiencies and recipe deviations.
The Results
| KPI / Feature | Outcome |
|---|---|
| Batch Visibility | Unified live & historical Gantt view |
| Accessibility | Shared dashboards across teams |
| Batch Comparisons | Linked Time Series enabled insights |
| Quality Monitoring | Improved with contextual data |
The Takeaway
With real-time batch tracking and visual tools in place, the team improved process control, reduced manual tracking, and elevated chocolate quality.
Want live visibility into your batch processes? Let’s bring clarity to your production line.
Access now
Share with a co-worker
The Challenge
The conching process is key to achieving the right texture and flavor in chocolate.
Given its sensitivity to time, temperature, and speed, manufacturers needed to:
- Build a unified view of ongoing batches and recipes
- Compare performance across batches
- Analyze Time Series Data for quality assurance and consistency
The Approach
To enable full traceability and real-time oversight, a structured, data-integrated solution was implemented:
- Connected the SQL batch database to TrendMiner for Gantt Chart visualization
- Where direct access wasn’t possible, ValueBased Searches were created per recipe and asset to identify all relevant conching cycles within the data.
- These Value Based Search results were linked to contextual events, enabling automated tracking in the Gantt view.
Through this enhanced data layer, experts can now visually navigate cycles and interact with them—just one click away from jumping into the Time Series Data for deeper analysis.
Breakthrough: The Gantt dashboard provided teams with a shared, realtime view across all assets, instantly revealing inefficiencies and recipe deviations.
The Results
| KPI / Feature | Outcome |
|---|---|
| Batch Visibility | Unified live & historical Gantt view |
| Accessibility | Shared dashboards across teams |
| Batch Comparisons | Linked Time Series enabled insights |
| Quality Monitoring | Improved with contextual data |
The Takeaway
With real-time batch tracking and visual tools in place, the team improved process control, reduced manual tracking, and elevated chocolate quality.
Want live visibility into your batch processes? Let’s bring clarity to your production line.
Access now
Subscribe to our newsletter
Stay up to date with our latest news and updates.
Webinars on Demand
Press Play on Operational Improvement
.jpg)
Other Resources
Explore Our Newest Content to Maximize Your Operational Efficiency