Share with a co-worker


The Challenge
A combined cycle power plant experienced a gradual decline in net power output over several years. Because the degradation was slow, it initially blended into normal variability and was not flagged as an acute incident, yet it accumulated into meaningful capacity loss and lost revenue.
Diagnosing the issue was difficult for three reasons. First, power output is strongly influenced by ambient temperature and operating mode, so any comparison of “good versus bad” performance can be misleading if conditions are not tightly matched. Second, the plant did not have a straightforward way to quantify the magnitude and duration of the loss, or to prove whether the trend was real versus just seasonal or dispatch driven variability. Third, potential causes span multiple subsystems, compressor airflow path, fuel and combustion, inlet guide vane behavior, controls, and instrumentation, so the team needed a structured way to narrow the search without weeks of manual trend reviews.
The Approach
Engineers built a comparison workflow to separate good versus bad performance under comparable conditions, then pinpoint the variables that consistently changed:
- Used value based searches to isolate stable operation, exclude shutdowns and low load periods
- Constrained ambient temperature to ensure apples to apples comparisons
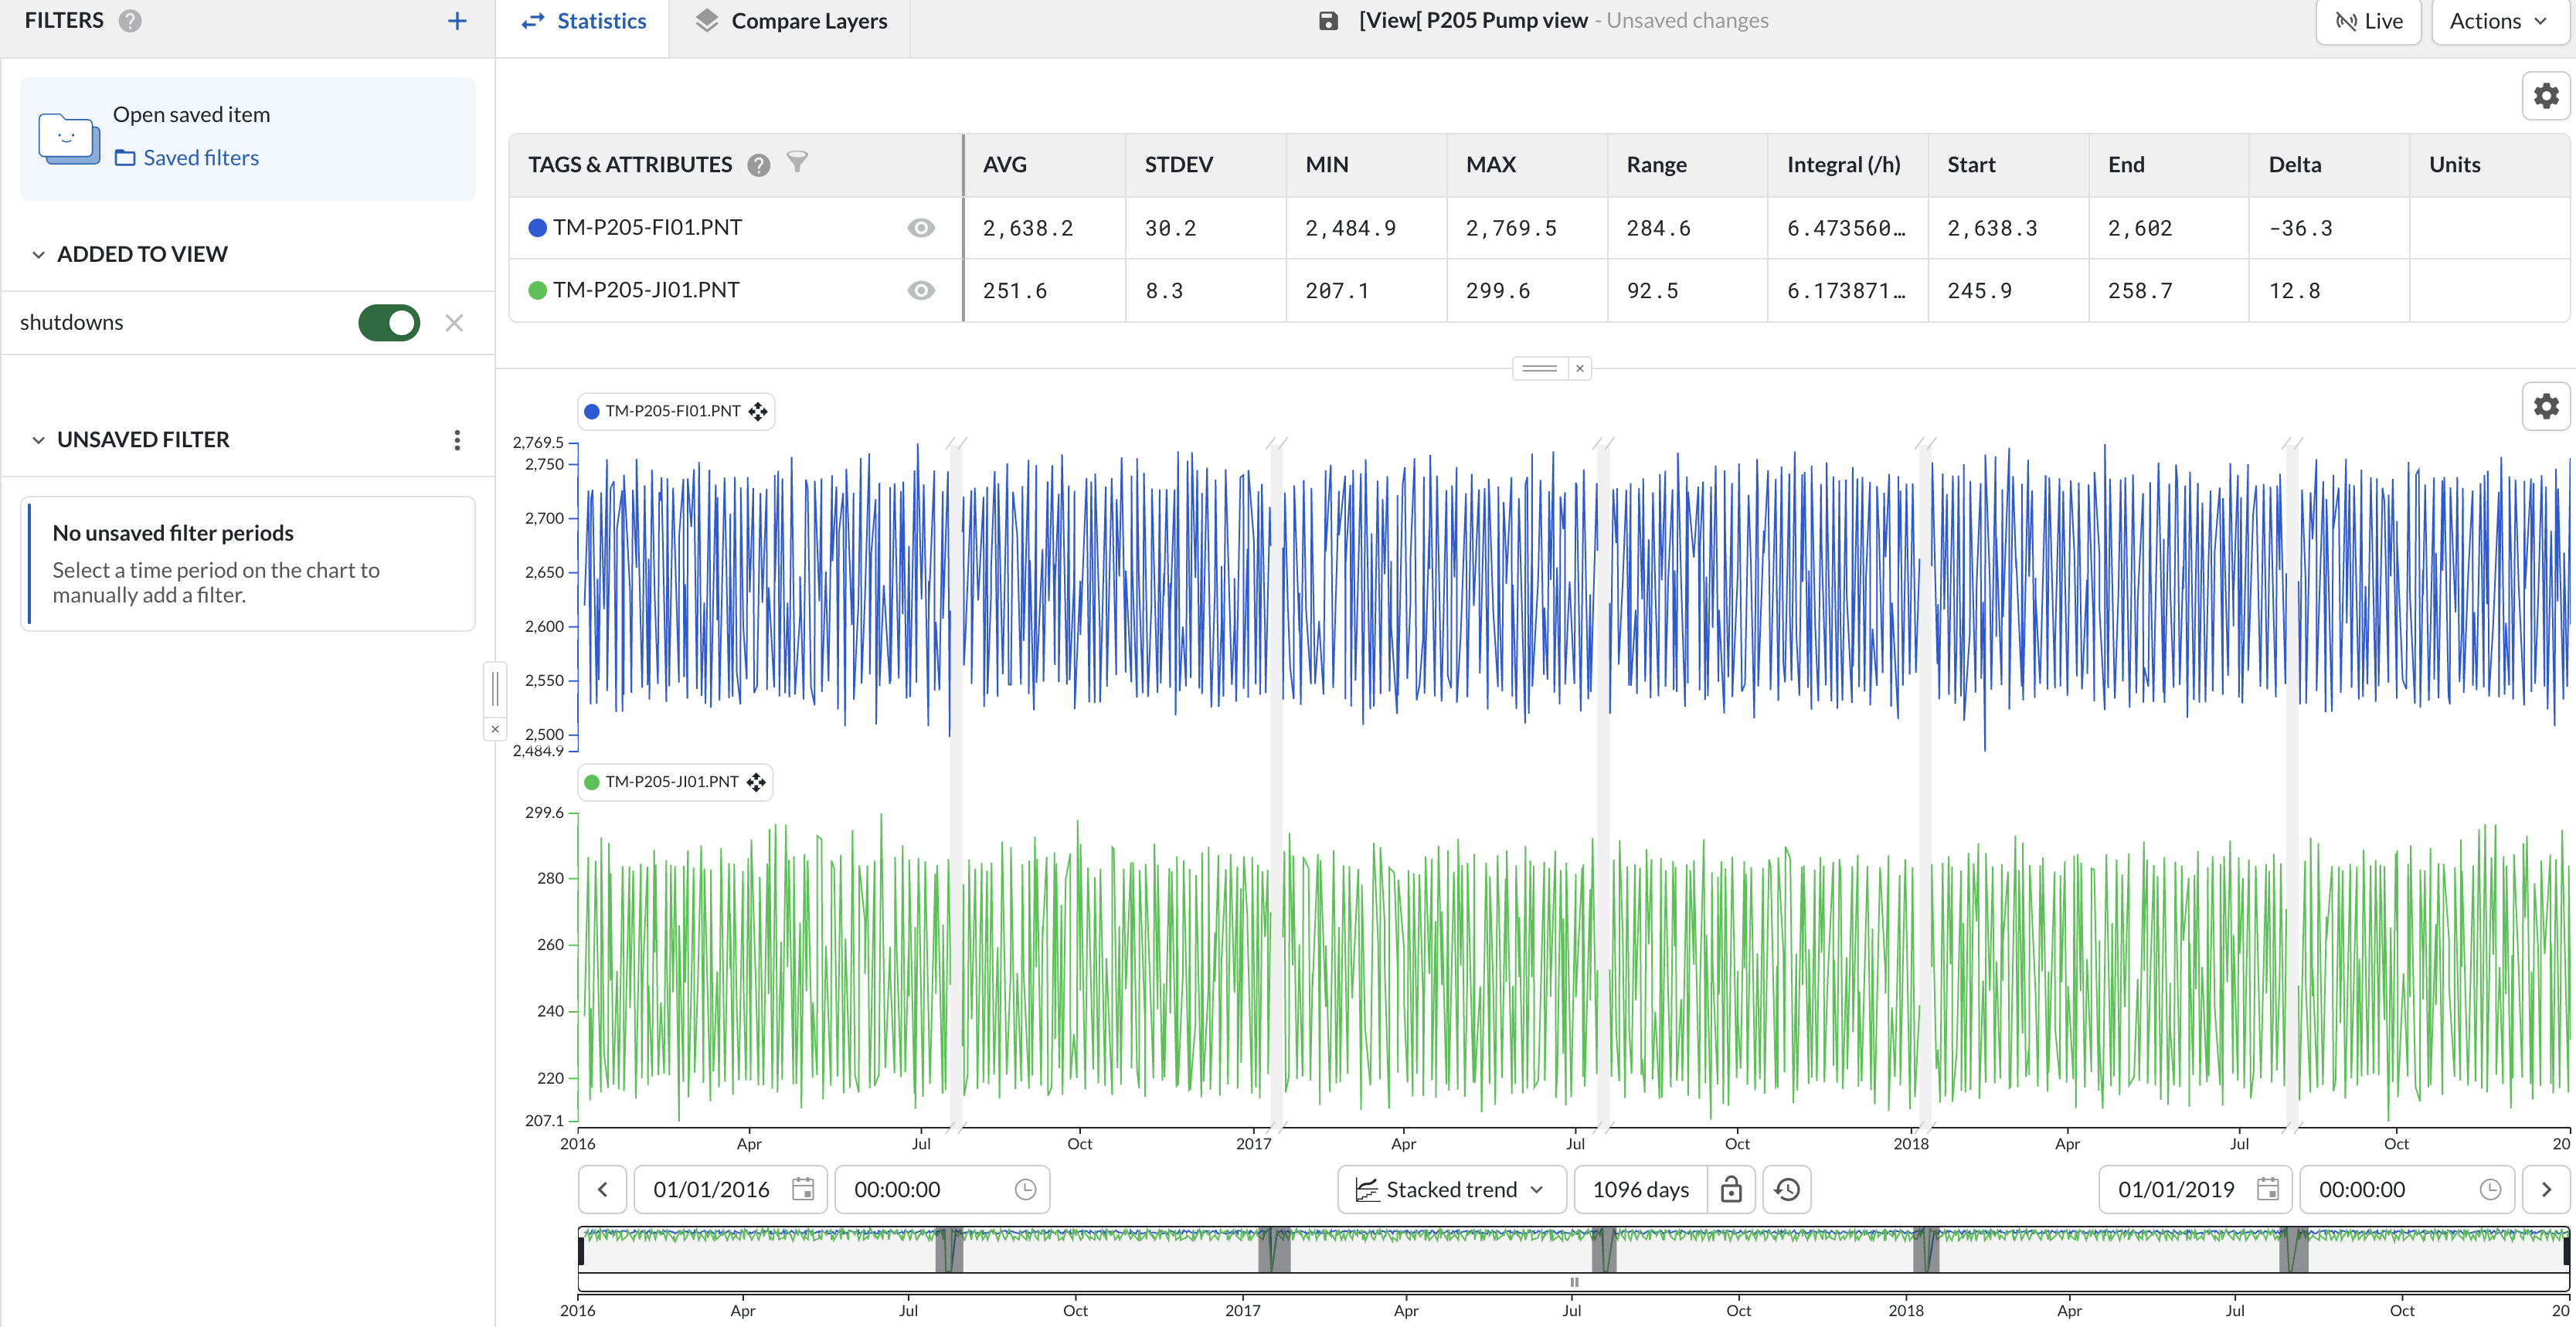
- Quantified the production gap using averages over long timeframes
- Layered high performance and low performance periods, used comparison tables to spot persistent deltas
- Identified consistent shifts in gas fuel flow, compressor discharge temperature, and inlet guide vane reference angle, leading to the hypothesis of inlet guide vane mis calibration and airflow restriction
- Captured findings with annotations for repeatability and knowledge transfer
The Results
The Takeaway
This workflow converted a slow, hard to detect degradation into a quantified, explainable problem with a clear corrective action. It reduced troubleshooting time dramatically, enabled repeatable performance audits, and supported an estimated ~$260K per year in recovered value through regained generation capacity.
The Challenge
A combined cycle power plant experienced a gradual decline in net power output over several years. Because the degradation was slow, it initially blended into normal variability and was not flagged as an acute incident, yet it accumulated into meaningful capacity loss and lost revenue.
Diagnosing the issue was difficult for three reasons. First, power output is strongly influenced by ambient temperature and operating mode, so any comparison of “good versus bad” performance can be misleading if conditions are not tightly matched. Second, the plant did not have a straightforward way to quantify the magnitude and duration of the loss, or to prove whether the trend was real versus just seasonal or dispatch driven variability. Third, potential causes span multiple subsystems, compressor airflow path, fuel and combustion, inlet guide vane behavior, controls, and instrumentation, so the team needed a structured way to narrow the search without weeks of manual trend reviews.
The Approach
Engineers built a comparison workflow to separate good versus bad performance under comparable conditions, then pinpoint the variables that consistently changed:
- Used value based searches to isolate stable operation, exclude shutdowns and low load periods
- Constrained ambient temperature to ensure apples to apples comparisons
- Quantified the production gap using averages over long timeframes
- Layered high performance and low performance periods, used comparison tables to spot persistent deltas
- Identified consistent shifts in gas fuel flow, compressor discharge temperature, and inlet guide vane reference angle, leading to the hypothesis of inlet guide vane mis calibration and airflow restriction
- Captured findings with annotations for repeatability and knowledge transfer
The Results
The Takeaway
This workflow converted a slow, hard to detect degradation into a quantified, explainable problem with a clear corrective action. It reduced troubleshooting time dramatically, enabled repeatable performance audits, and supported an estimated ~$260K per year in recovered value through regained generation capacity.
Access now
Share with a co-worker
The Challenge
A combined cycle power plant experienced a gradual decline in net power output over several years. Because the degradation was slow, it initially blended into normal variability and was not flagged as an acute incident, yet it accumulated into meaningful capacity loss and lost revenue.
Diagnosing the issue was difficult for three reasons. First, power output is strongly influenced by ambient temperature and operating mode, so any comparison of “good versus bad” performance can be misleading if conditions are not tightly matched. Second, the plant did not have a straightforward way to quantify the magnitude and duration of the loss, or to prove whether the trend was real versus just seasonal or dispatch driven variability. Third, potential causes span multiple subsystems, compressor airflow path, fuel and combustion, inlet guide vane behavior, controls, and instrumentation, so the team needed a structured way to narrow the search without weeks of manual trend reviews.
The Approach
Engineers built a comparison workflow to separate good versus bad performance under comparable conditions, then pinpoint the variables that consistently changed:
- Used value based searches to isolate stable operation, exclude shutdowns and low load periods
- Constrained ambient temperature to ensure apples to apples comparisons
- Quantified the production gap using averages over long timeframes
- Layered high performance and low performance periods, used comparison tables to spot persistent deltas
- Identified consistent shifts in gas fuel flow, compressor discharge temperature, and inlet guide vane reference angle, leading to the hypothesis of inlet guide vane mis calibration and airflow restriction
- Captured findings with annotations for repeatability and knowledge transfer
The Results
The Takeaway
This workflow converted a slow, hard to detect degradation into a quantified, explainable problem with a clear corrective action. It reduced troubleshooting time dramatically, enabled repeatable performance audits, and supported an estimated ~$260K per year in recovered value through regained generation capacity.
Access now
Subscribe to our newsletter
Stay up to date with our latest news and updates.
Webinars on Demand
Press Play on Operational Improvement
.jpg)
.jpg)
.jpg)
Other Resources
Explore Our Newest Content to Maximize Your Operational Efficiency