Share with a co-worker
All Resources
Use case


The Challenge
A fluidised bed burner used for sewage sludge and waste incineration gradually loses performance over time due to plate clogging caused by ash and material buildup. As air holes become blocked:
- Valves progressively open to maintain airflow
- Compressors eventually operate at maximum power
- Differential pressure peaks
- Airflow begins to decrease despite full valve opening
When airflow drops below 10,000 m³/h, the burner must be shut down for cleaning. Poor maintenance planning can result in multiple burners being offline simultaneously, forcing compensation through natural gas combustion and increasing operational costs.
The challenge was to:
- Quantify burner performance in a structured way
- Track degradation over time
- Enable predictive maintenance scheduling
- Avoid reactive shutdowns and overlapping outages
The Approach
A performance monitoring framework was developed using calculated tags and comparative analytics:
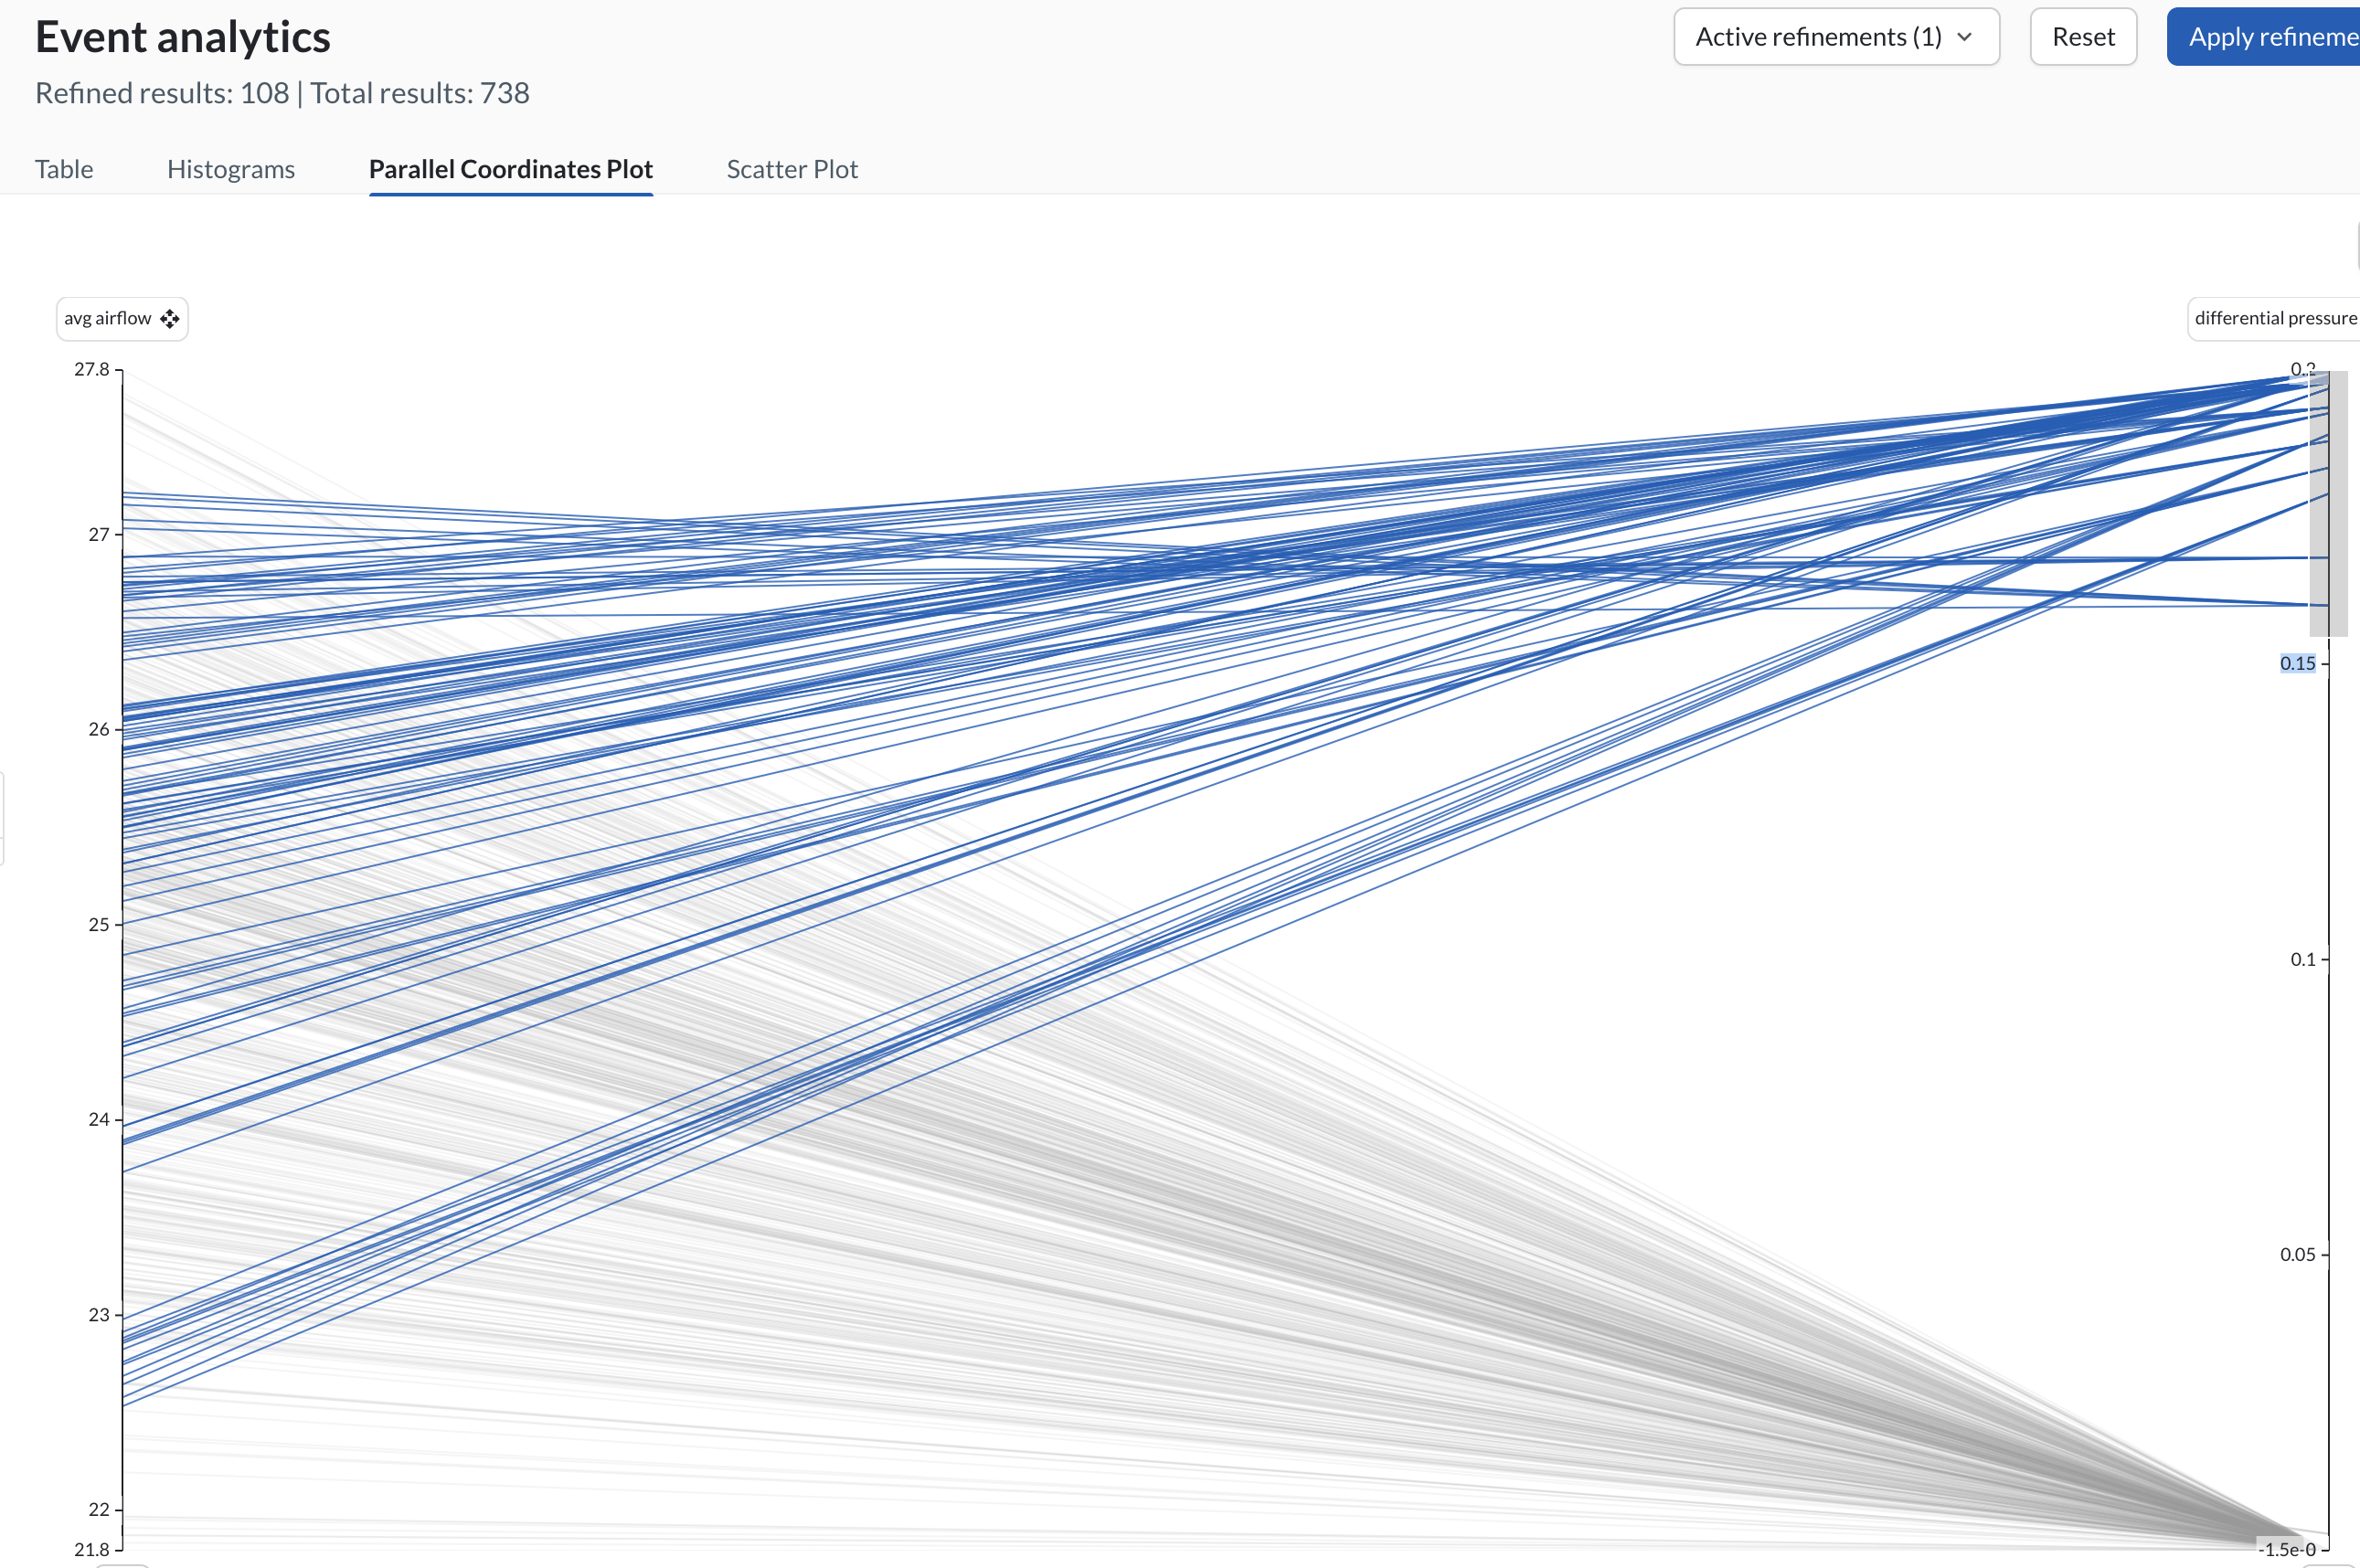
- A custom performance index was created using airflow and pressure data
- A 10-day shifted derivative calculation was implemented to measure performance change over time
- Shifted tags enabled degradation trend analysis
- Historical operating periods with different runtimes were layered for comparison
- Average values were compared using layer tables
- Value-Based Searches were configured to detect low-performance conditions
- Monitors were created to flag performance decline in real time
This enabled continuous visibility into burner health and degradation rate.
The Results
The Takeaway
The new live performance tag transformed burner maintenance from reactive cleaning to data-driven condition monitoring. By quantifying degradation and identifying abnormal operating periods early, the plant can optimize cleaning intervals, avoid simultaneous burner outages, reduce natural gas compensation costs, and improve overall operational reliability.
The Challenge
A fluidised bed burner used for sewage sludge and waste incineration gradually loses performance over time due to plate clogging caused by ash and material buildup. As air holes become blocked:
- Valves progressively open to maintain airflow
- Compressors eventually operate at maximum power
- Differential pressure peaks
- Airflow begins to decrease despite full valve opening
When airflow drops below 10,000 m³/h, the burner must be shut down for cleaning. Poor maintenance planning can result in multiple burners being offline simultaneously, forcing compensation through natural gas combustion and increasing operational costs.
The challenge was to:
- Quantify burner performance in a structured way
- Track degradation over time
- Enable predictive maintenance scheduling
- Avoid reactive shutdowns and overlapping outages
The Approach
A performance monitoring framework was developed using calculated tags and comparative analytics:
- A custom performance index was created using airflow and pressure data
- A 10-day shifted derivative calculation was implemented to measure performance change over time
- Shifted tags enabled degradation trend analysis
- Historical operating periods with different runtimes were layered for comparison
- Average values were compared using layer tables
- Value-Based Searches were configured to detect low-performance conditions
- Monitors were created to flag performance decline in real time
This enabled continuous visibility into burner health and degradation rate.
The Results
The Takeaway
The new live performance tag transformed burner maintenance from reactive cleaning to data-driven condition monitoring. By quantifying degradation and identifying abnormal operating periods early, the plant can optimize cleaning intervals, avoid simultaneous burner outages, reduce natural gas compensation costs, and improve overall operational reliability.
Access now
Share with a co-worker
The Challenge
A fluidised bed burner used for sewage sludge and waste incineration gradually loses performance over time due to plate clogging caused by ash and material buildup. As air holes become blocked:
- Valves progressively open to maintain airflow
- Compressors eventually operate at maximum power
- Differential pressure peaks
- Airflow begins to decrease despite full valve opening
When airflow drops below 10,000 m³/h, the burner must be shut down for cleaning. Poor maintenance planning can result in multiple burners being offline simultaneously, forcing compensation through natural gas combustion and increasing operational costs.
The challenge was to:
- Quantify burner performance in a structured way
- Track degradation over time
- Enable predictive maintenance scheduling
- Avoid reactive shutdowns and overlapping outages
The Approach
A performance monitoring framework was developed using calculated tags and comparative analytics:
- A custom performance index was created using airflow and pressure data
- A 10-day shifted derivative calculation was implemented to measure performance change over time
- Shifted tags enabled degradation trend analysis
- Historical operating periods with different runtimes were layered for comparison
- Average values were compared using layer tables
- Value-Based Searches were configured to detect low-performance conditions
- Monitors were created to flag performance decline in real time
This enabled continuous visibility into burner health and degradation rate.
The Results
The Takeaway
The new live performance tag transformed burner maintenance from reactive cleaning to data-driven condition monitoring. By quantifying degradation and identifying abnormal operating periods early, the plant can optimize cleaning intervals, avoid simultaneous burner outages, reduce natural gas compensation costs, and improve overall operational reliability.
Access now
Subscribe to our newsletter
Stay up to date with our latest news and updates.
Webinars on Demand
Press Play on Operational Improvement
.jpg)
.jpg)
.jpg)
Other Resources
Explore Our Newest Content to Maximize Your Operational Efficiency