Share with a co-worker


The Challenge
Periods of excessive emission rates needed to be analyzed to identify their root causes and prevent recurrence, without reducing the plant’s overall power generation. This created a dual constraint scenario where environmental performance had to improve while maintaining production targets.
The main difficulty was that emissions do not behave independently. They are influenced by multiple upstream process variables and operating conditions, especially generated power. Without understanding the quantitative relationship between emissions and production, engineers could not determine whether high emissions were unavoidable process behavior or indicators of inefficiency or malfunction.
Additionally, the lack of predictive insight meant corrective actions were reactive rather than preventive, increasing the risk of compliance issues and operational instability.
The Approach
Engineers developed a data driven methodology to model and operationalize the relationship between generated power and gas emissions.
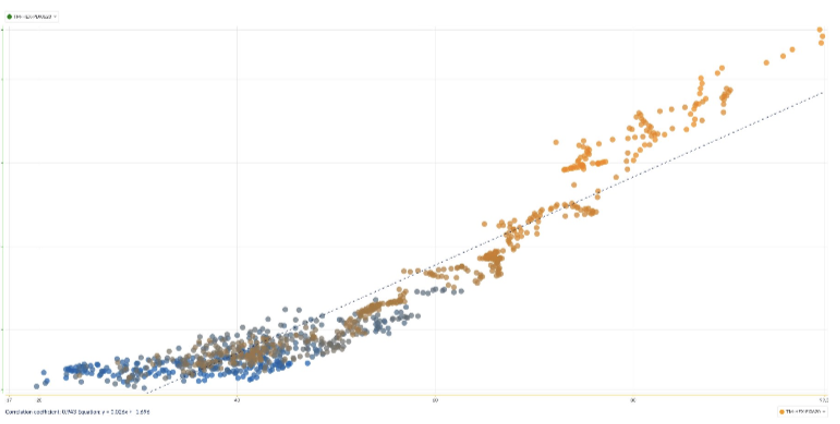
First, historical process data was analyzed to identify correlations between emissions and production levels. Scatter plots were used to visualize how emission values behaved across different operating ranges, revealing a clear relationship pattern.
Next, TrendMiner prediction functionality was used to generate a regression model describing the dependency between emission gases and generated power. This model allowed engineers to estimate expected emissions for any given power level.
Using this equation, the team created a predictive indicator capable of calculating expected emissions based on desired power output. Monitors were configured to automatically alert operators whenever actual emissions exceeded predicted values, signaling abnormal conditions or inefficiencies.
The Results
The Takeaway
This analysis enabled engineers to proactively control emissions rather than react to exceedances. By linking environmental performance directly to production variables, the plant gained a practical decision support tool that balances sustainability and output.
The approach reduced emissions by approximately 4 percent while maintaining full process power generation, demonstrating how advanced analytics can simultaneously improve compliance, efficiency, and operational stability.
The Challenge
Periods of excessive emission rates needed to be analyzed to identify their root causes and prevent recurrence, without reducing the plant’s overall power generation. This created a dual constraint scenario where environmental performance had to improve while maintaining production targets.
The main difficulty was that emissions do not behave independently. They are influenced by multiple upstream process variables and operating conditions, especially generated power. Without understanding the quantitative relationship between emissions and production, engineers could not determine whether high emissions were unavoidable process behavior or indicators of inefficiency or malfunction.
Additionally, the lack of predictive insight meant corrective actions were reactive rather than preventive, increasing the risk of compliance issues and operational instability.
The Approach
Engineers developed a data driven methodology to model and operationalize the relationship between generated power and gas emissions.
First, historical process data was analyzed to identify correlations between emissions and production levels. Scatter plots were used to visualize how emission values behaved across different operating ranges, revealing a clear relationship pattern.
Next, TrendMiner prediction functionality was used to generate a regression model describing the dependency between emission gases and generated power. This model allowed engineers to estimate expected emissions for any given power level.
Using this equation, the team created a predictive indicator capable of calculating expected emissions based on desired power output. Monitors were configured to automatically alert operators whenever actual emissions exceeded predicted values, signaling abnormal conditions or inefficiencies.
The Results
The Takeaway
This analysis enabled engineers to proactively control emissions rather than react to exceedances. By linking environmental performance directly to production variables, the plant gained a practical decision support tool that balances sustainability and output.
The approach reduced emissions by approximately 4 percent while maintaining full process power generation, demonstrating how advanced analytics can simultaneously improve compliance, efficiency, and operational stability.
Access now
Share with a co-worker
The Challenge
Periods of excessive emission rates needed to be analyzed to identify their root causes and prevent recurrence, without reducing the plant’s overall power generation. This created a dual constraint scenario where environmental performance had to improve while maintaining production targets.
The main difficulty was that emissions do not behave independently. They are influenced by multiple upstream process variables and operating conditions, especially generated power. Without understanding the quantitative relationship between emissions and production, engineers could not determine whether high emissions were unavoidable process behavior or indicators of inefficiency or malfunction.
Additionally, the lack of predictive insight meant corrective actions were reactive rather than preventive, increasing the risk of compliance issues and operational instability.
The Approach
Engineers developed a data driven methodology to model and operationalize the relationship between generated power and gas emissions.
First, historical process data was analyzed to identify correlations between emissions and production levels. Scatter plots were used to visualize how emission values behaved across different operating ranges, revealing a clear relationship pattern.
Next, TrendMiner prediction functionality was used to generate a regression model describing the dependency between emission gases and generated power. This model allowed engineers to estimate expected emissions for any given power level.
Using this equation, the team created a predictive indicator capable of calculating expected emissions based on desired power output. Monitors were configured to automatically alert operators whenever actual emissions exceeded predicted values, signaling abnormal conditions or inefficiencies.
The Results
The Takeaway
This analysis enabled engineers to proactively control emissions rather than react to exceedances. By linking environmental performance directly to production variables, the plant gained a practical decision support tool that balances sustainability and output.
The approach reduced emissions by approximately 4 percent while maintaining full process power generation, demonstrating how advanced analytics can simultaneously improve compliance, efficiency, and operational stability.
Access now
Subscribe to our newsletter
Stay up to date with our latest news and updates.
Webinars on Demand
Press Play on Operational Improvement
.jpg)
.jpg)
.jpg)
Other Resources
Explore Our Newest Content to Maximize Your Operational Efficiency