Share with a co-worker
All Resources
Use case


The Challenge
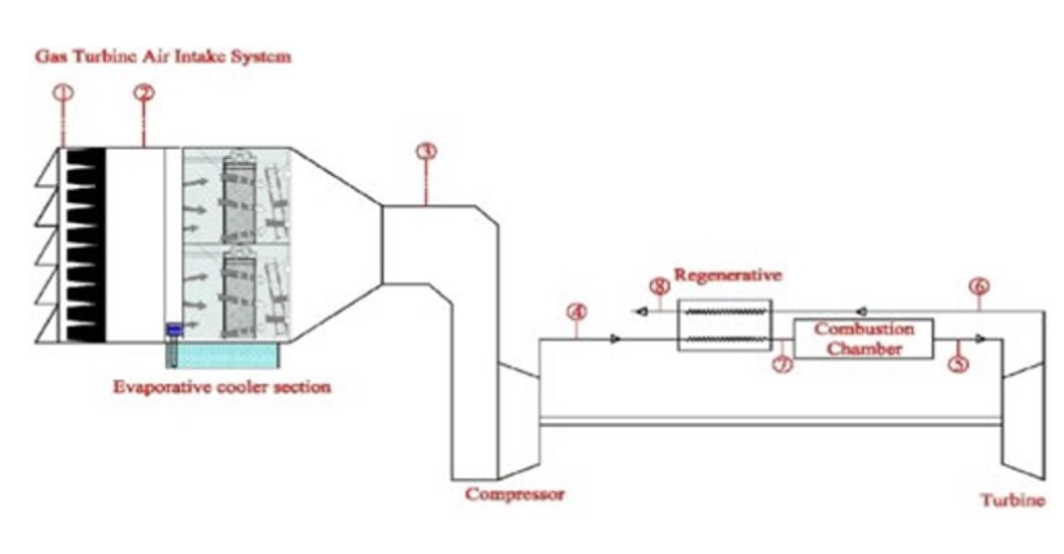
In combined cycle power plants, evaporative coolers play a critical role in conditioning inlet air for gas turbines. Their performance directly affects turbine efficiency, output, and fuel consumption. However, cooler effectiveness is highly dependent on external meteorological conditions such as ambient temperature and humidity, making it difficult to distinguish true performance issues from normal environmental variation.
Engineers needed a reliable way to quantify how weather conditions influenced cooler performance and determine whether deviations were due to atmospheric factors or operational anomalies. Without a structured analysis approach, identifying underperformance periods or non optimal operating decisions required time consuming manual investigation and often led to missed optimization opportunities.
The Approach
Engineers implemented a correlation driven monitoring workflow designed to isolate environmental effects and reveal hidden performance patterns:
- Applied value based searches to isolate operating regimes such as normal conditions and high temperature scenarios
- Filtered datasets to compare equivalent operating contexts rather than raw trends
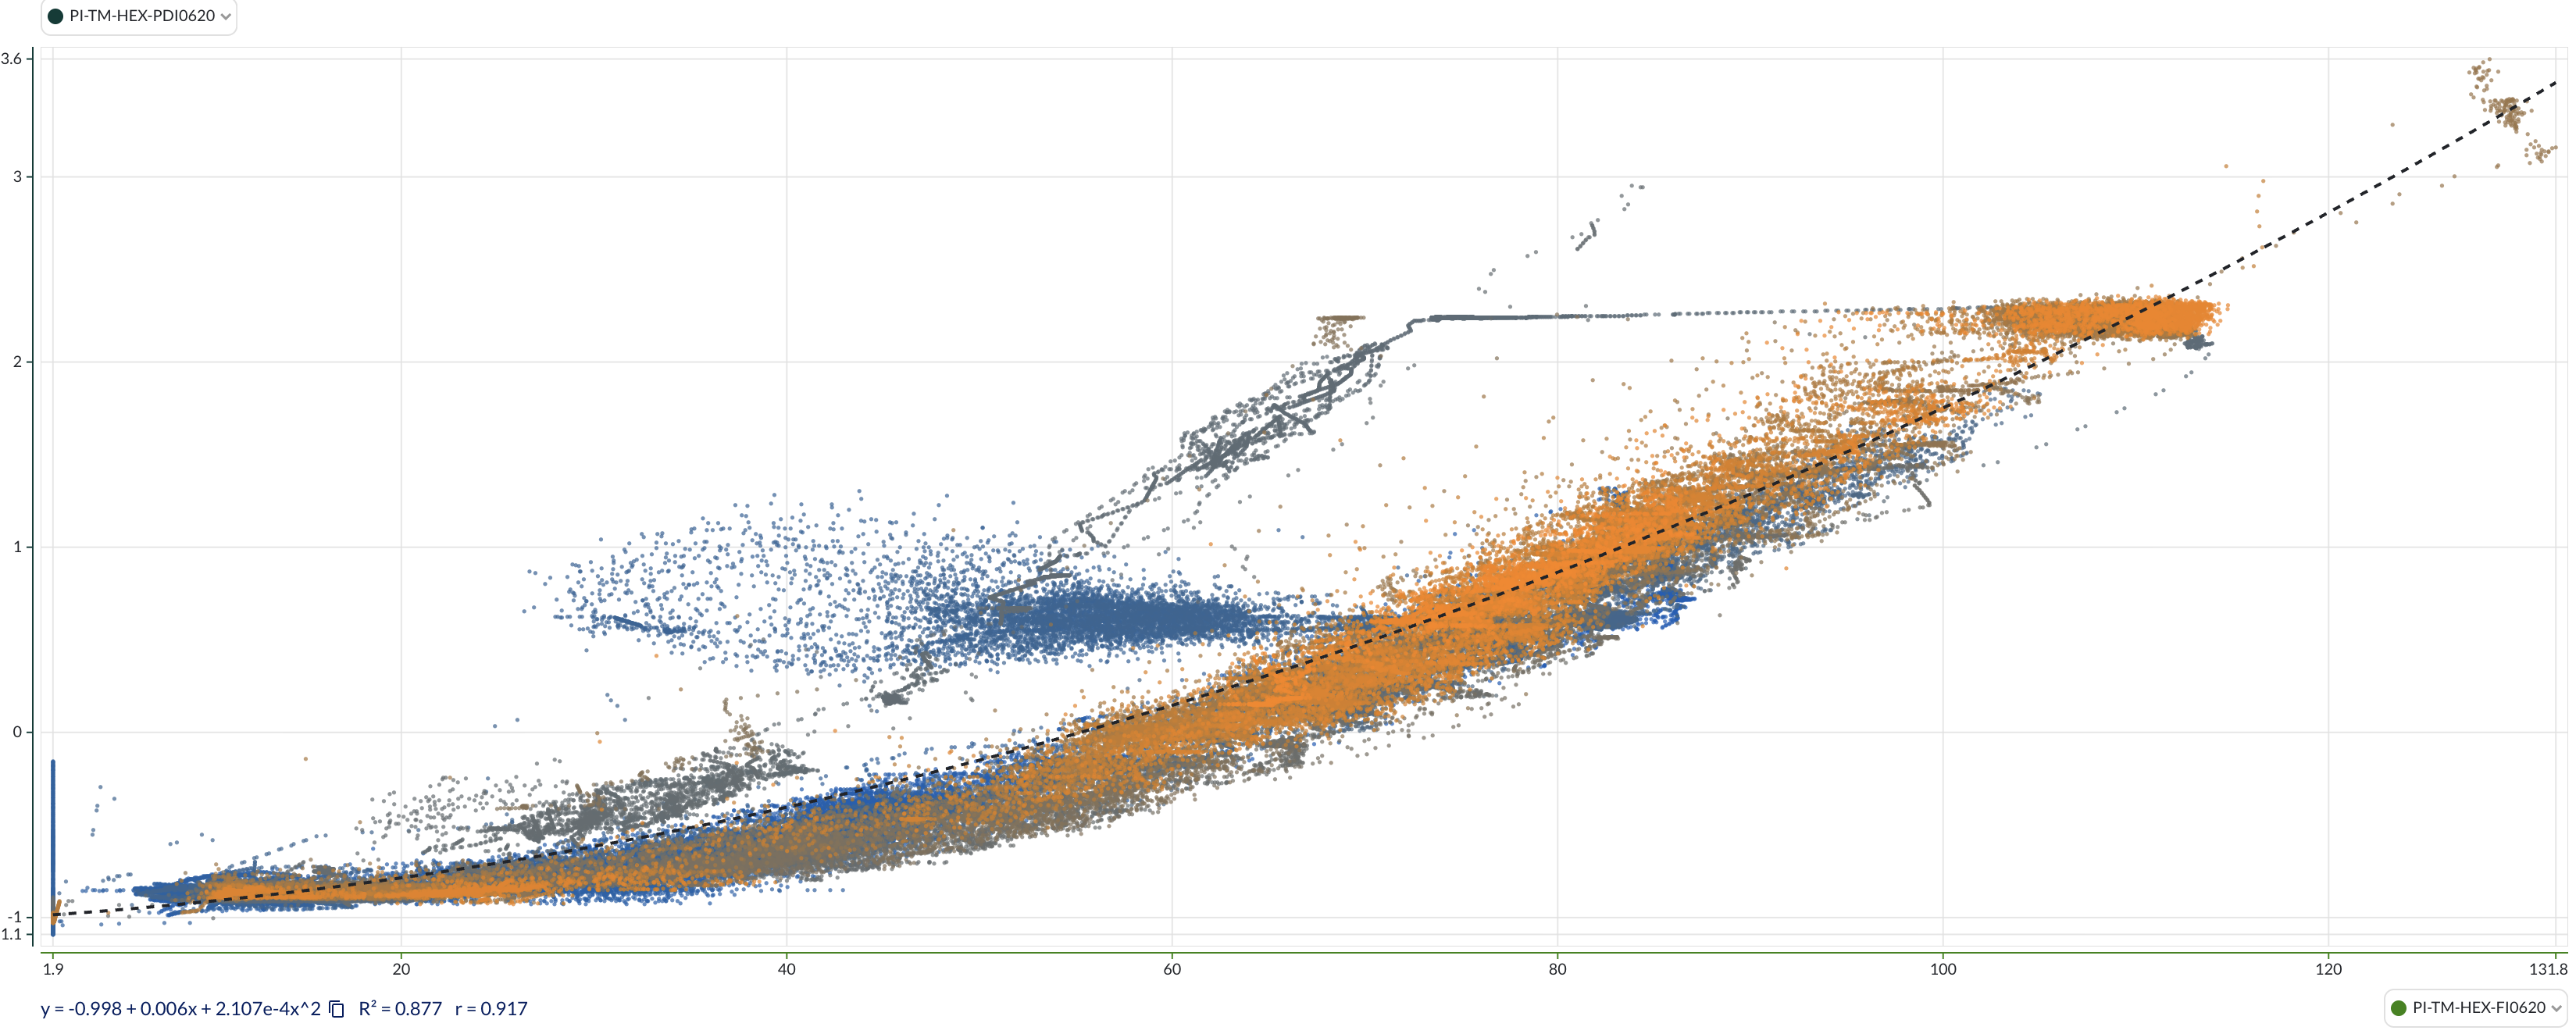
- Used scatter plot analysis to quantify relationships between meteorological variables and cooler output
- Evaluated correlations to distinguish natural performance limits from abnormal behavior
- Investigated outlier periods to identify operational deviations or missed activation windows
This structured method allowed the team to move from qualitative assumptions about weather impact to quantitative performance intelligence.
The Results
The Takeaway
The analysis provided a data driven foundation for optimizing cooler operation instead of relying on heuristics or manual monitoring. By implementing monitors and making small process adjustments based on the findings, the plant increased cooler availability and achieved roughly a 1 percent production increase, while also establishing a repeatable method for ongoing performance optimization and anomaly detection.
The Challenge
In combined cycle power plants, evaporative coolers play a critical role in conditioning inlet air for gas turbines. Their performance directly affects turbine efficiency, output, and fuel consumption. However, cooler effectiveness is highly dependent on external meteorological conditions such as ambient temperature and humidity, making it difficult to distinguish true performance issues from normal environmental variation.
Engineers needed a reliable way to quantify how weather conditions influenced cooler performance and determine whether deviations were due to atmospheric factors or operational anomalies. Without a structured analysis approach, identifying underperformance periods or non optimal operating decisions required time consuming manual investigation and often led to missed optimization opportunities.
The Approach
Engineers implemented a correlation driven monitoring workflow designed to isolate environmental effects and reveal hidden performance patterns:
- Applied value based searches to isolate operating regimes such as normal conditions and high temperature scenarios
- Filtered datasets to compare equivalent operating contexts rather than raw trends
- Used scatter plot analysis to quantify relationships between meteorological variables and cooler output
- Evaluated correlations to distinguish natural performance limits from abnormal behavior
- Investigated outlier periods to identify operational deviations or missed activation windows
This structured method allowed the team to move from qualitative assumptions about weather impact to quantitative performance intelligence.
The Results
The Takeaway
The analysis provided a data driven foundation for optimizing cooler operation instead of relying on heuristics or manual monitoring. By implementing monitors and making small process adjustments based on the findings, the plant increased cooler availability and achieved roughly a 1 percent production increase, while also establishing a repeatable method for ongoing performance optimization and anomaly detection.
Access now
Share with a co-worker
The Challenge
In combined cycle power plants, evaporative coolers play a critical role in conditioning inlet air for gas turbines. Their performance directly affects turbine efficiency, output, and fuel consumption. However, cooler effectiveness is highly dependent on external meteorological conditions such as ambient temperature and humidity, making it difficult to distinguish true performance issues from normal environmental variation.
Engineers needed a reliable way to quantify how weather conditions influenced cooler performance and determine whether deviations were due to atmospheric factors or operational anomalies. Without a structured analysis approach, identifying underperformance periods or non optimal operating decisions required time consuming manual investigation and often led to missed optimization opportunities.
The Approach
Engineers implemented a correlation driven monitoring workflow designed to isolate environmental effects and reveal hidden performance patterns:
- Applied value based searches to isolate operating regimes such as normal conditions and high temperature scenarios
- Filtered datasets to compare equivalent operating contexts rather than raw trends
- Used scatter plot analysis to quantify relationships between meteorological variables and cooler output
- Evaluated correlations to distinguish natural performance limits from abnormal behavior
- Investigated outlier periods to identify operational deviations or missed activation windows
This structured method allowed the team to move from qualitative assumptions about weather impact to quantitative performance intelligence.
The Results
The Takeaway
The analysis provided a data driven foundation for optimizing cooler operation instead of relying on heuristics or manual monitoring. By implementing monitors and making small process adjustments based on the findings, the plant increased cooler availability and achieved roughly a 1 percent production increase, while also establishing a repeatable method for ongoing performance optimization and anomaly detection.
Access now
Subscribe to our newsletter
Stay up to date with our latest news and updates.
Webinars on Demand
Press Play on Operational Improvement
.jpg)
.jpg)
.jpg)
Other Resources
Explore Our Newest Content to Maximize Your Operational Efficiency