Share with a co-worker

The Challenge
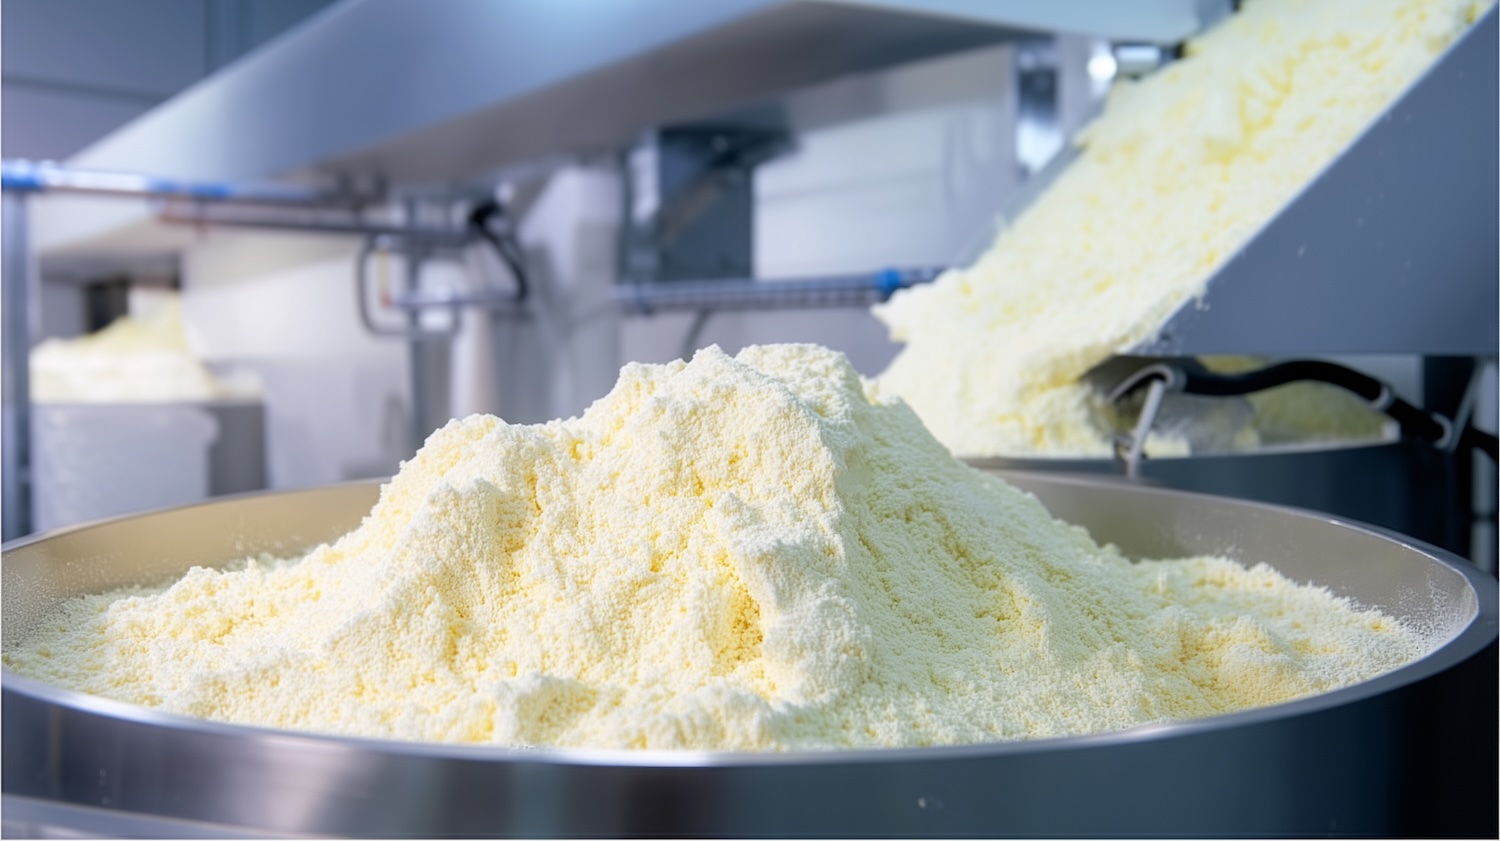
Spray dryers are critical in milk powder production — they consume the most energy and complete the drying process. Tracking their performance is essential, especially when comparing multiple plants.
The Goal
- Monitor spray dryer phases and status
- Contextualize downtimes, anomalies, and startups
- Enable plant-to-plant performance comparison
The Approach
- Phase Detection & FollowUp: used step tags to detect and classify phases, applying valuebased searches and realtime monitors for full tracking.
- Shutdown Contextualization: linked controlled and emergency shutdowns to phases, integrating all info into a unified view.
- Startup Delay Highlighting: applied color coding to mark delayed startups in red based on duration, making anomalies visible.
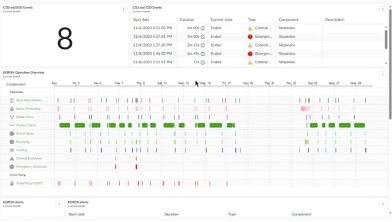
- Dashboard Integration: combined a Gantt chart of phases, a startup table with color coding, and a shutdown table with event counter.
Insight
All key events are now visible in one dashboard — enabling faster decisions and crossplant benchmarking.
The Results
The Takeaway
A centralized dashboard helps teams monitor spray dryer health, compare sites, and optimize operations with clarity and speed. Want instant insights into your spray dryer performance? Let’s make every phase count.
The Challenge
Spray dryers are critical in milk powder production — they consume the most energy and complete the drying process. Tracking their performance is essential, especially when comparing multiple plants.
The Goal
- Monitor spray dryer phases and status
- Contextualize downtimes, anomalies, and startups
- Enable plant-to-plant performance comparison
The Approach
- Phase Detection & FollowUp: used step tags to detect and classify phases, applying valuebased searches and realtime monitors for full tracking.
- Shutdown Contextualization: linked controlled and emergency shutdowns to phases, integrating all info into a unified view.
- Startup Delay Highlighting: applied color coding to mark delayed startups in red based on duration, making anomalies visible.
- Dashboard Integration: combined a Gantt chart of phases, a startup table with color coding, and a shutdown table with event counter.
Insight
All key events are now visible in one dashboard — enabling faster decisions and crossplant benchmarking.
The Results
The Takeaway
A centralized dashboard helps teams monitor spray dryer health, compare sites, and optimize operations with clarity and speed. Want instant insights into your spray dryer performance? Let’s make every phase count.
Access now
Share with a co-worker
The Challenge
Spray dryers are critical in milk powder production — they consume the most energy and complete the drying process. Tracking their performance is essential, especially when comparing multiple plants.
The Goal
- Monitor spray dryer phases and status
- Contextualize downtimes, anomalies, and startups
- Enable plant-to-plant performance comparison
The Approach
- Phase Detection & FollowUp: used step tags to detect and classify phases, applying valuebased searches and realtime monitors for full tracking.
- Shutdown Contextualization: linked controlled and emergency shutdowns to phases, integrating all info into a unified view.
- Startup Delay Highlighting: applied color coding to mark delayed startups in red based on duration, making anomalies visible.
- Dashboard Integration: combined a Gantt chart of phases, a startup table with color coding, and a shutdown table with event counter.
Insight
All key events are now visible in one dashboard — enabling faster decisions and crossplant benchmarking.
The Results
The Takeaway
A centralized dashboard helps teams monitor spray dryer health, compare sites, and optimize operations with clarity and speed. Want instant insights into your spray dryer performance? Let’s make every phase count.
Access now
Subscribe to our newsletter
Stay up to date with our latest news and updates.
Webinars on Demand
Press Play on Operational Improvement

.jpg)
Other Resources
Explore Our Newest Content to Maximize Your Operational Efficiency