Share with a co-worker

The Challenge
A site relied on fixed-time evaporator cleanings, causing:
- Unnecessary downtimes
- Underused capacity
- Bottlenecking in production
No real-time check confirmed if cleaning was truly needed.
The Approach
The team built custom formulas in TrendMiner and enabled real-time monitoring of key KPIs to ensure efficiency and quality:
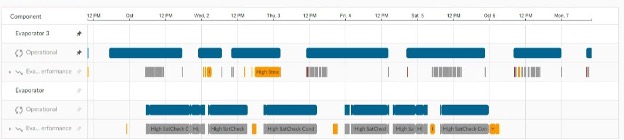
- Evaporator performance (U Coefficient): calculated and tracked to detect fouling or clogging early.
- Product density stability: derived through formulas to spot process deviations affecting quality.
- Condenser saturation behavior: computed to reveal potential air leaks.
- Condenser temperature differential: formulated to identify reduced cooling efficiency.
- Steam-to-water ratio: created to optimize steam usage versus actual evaporation.
Dashboard Integration: all these formula-based KPIs are displayed in a single panel with trends, alerts, and event links for quick action.
Key Insight: The U Coefficient stayed stable beyond typical runtimes, proving no fouling and enabling extended operation periods with smarter, condition-based cleaning schedules.
Results
Takeaway
Switching from fixed to KPI-based operation unlocked major gains—all without new equipment. Want to explore your hidden capacity? Let’s talk.
The Challenge
A site relied on fixed-time evaporator cleanings, causing:
- Unnecessary downtimes
- Underused capacity
- Bottlenecking in production
No real-time check confirmed if cleaning was truly needed.
The Approach
The team built custom formulas in TrendMiner and enabled real-time monitoring of key KPIs to ensure efficiency and quality:
- Evaporator performance (U Coefficient): calculated and tracked to detect fouling or clogging early.
- Product density stability: derived through formulas to spot process deviations affecting quality.
- Condenser saturation behavior: computed to reveal potential air leaks.
- Condenser temperature differential: formulated to identify reduced cooling efficiency.
- Steam-to-water ratio: created to optimize steam usage versus actual evaporation.
Dashboard Integration: all these formula-based KPIs are displayed in a single panel with trends, alerts, and event links for quick action.
Key Insight: The U Coefficient stayed stable beyond typical runtimes, proving no fouling and enabling extended operation periods with smarter, condition-based cleaning schedules.
Results
Takeaway
Switching from fixed to KPI-based operation unlocked major gains—all without new equipment. Want to explore your hidden capacity? Let’s talk.
Access now
Share with a co-worker
The Challenge
A site relied on fixed-time evaporator cleanings, causing:
- Unnecessary downtimes
- Underused capacity
- Bottlenecking in production
No real-time check confirmed if cleaning was truly needed.
The Approach
The team built custom formulas in TrendMiner and enabled real-time monitoring of key KPIs to ensure efficiency and quality:
- Evaporator performance (U Coefficient): calculated and tracked to detect fouling or clogging early.
- Product density stability: derived through formulas to spot process deviations affecting quality.
- Condenser saturation behavior: computed to reveal potential air leaks.
- Condenser temperature differential: formulated to identify reduced cooling efficiency.
- Steam-to-water ratio: created to optimize steam usage versus actual evaporation.
Dashboard Integration: all these formula-based KPIs are displayed in a single panel with trends, alerts, and event links for quick action.
Key Insight: The U Coefficient stayed stable beyond typical runtimes, proving no fouling and enabling extended operation periods with smarter, condition-based cleaning schedules.
Results
Takeaway
Switching from fixed to KPI-based operation unlocked major gains—all without new equipment. Want to explore your hidden capacity? Let’s talk.
Access now
Subscribe to our newsletter
Stay up to date with our latest news and updates.
Webinars on Demand
Press Play on Operational Improvement
.jpg)
Other Resources
Explore Our Newest Content to Maximize Your Operational Efficiency