Share with a co-worker

A single unplanned tool failure stops production. In high-value discrete manufacturing, an hour of unplanned downtime ranges from several thousand euros in smaller operations to over a million in the most capital-intensive environments. (Siemens True Cost of Downtime 2024, ABB Value of Reliability 2023). Predictive approaches consistently reduce unplanned downtime and extend equipment life. Applied across multiple assets, the value scales accordingly.
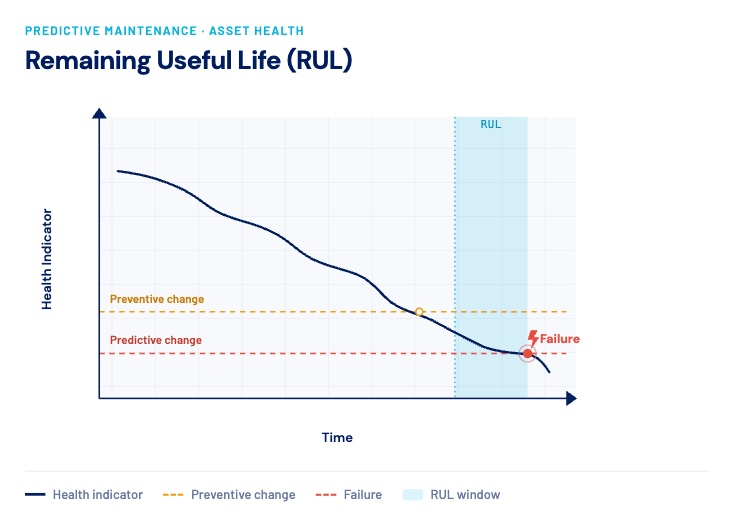
The challenge is knowing when a tool is actually approaching the end of its life. Replacing too early wastes usable tool life and production time. Replacing too late risks the failure that stops the line. Fixed maintenance schedules cannot resolve this tension because they ignore the actual condition of the tool. This is where Remaining Useful Life prediction comes in.
What is RUL?
Remaining Useful Life (RUL) is defined as the time remaining for a component to perform its intended function before failure. Accurate RUL estimation allows process experts to schedule maintenance proactively, avoid unplanned downtime, and reduce unnecessary replacement costs. For this reason, RUL estimation is a key focus in predictive maintenance programs across discrete and process manufacturing.
The Challenge
In precision manufacturing environments, tool condition directly determines dimensional accuracy and surface quality. A single undetected tool failure can compromise an entire production run, resulting in scrap, rework, and unplanned downtime.
Traditionally, extensive data engineering was required to clean and prepare data for each machine individually. Tool changes were performed on fixed time schedules because neither a standardised prediction workflow existed, nor live monitoring was possible. As a result, actual tool condition remained largely unknown, increasing the risk of premature failures or underutilised tool life.
The Approach
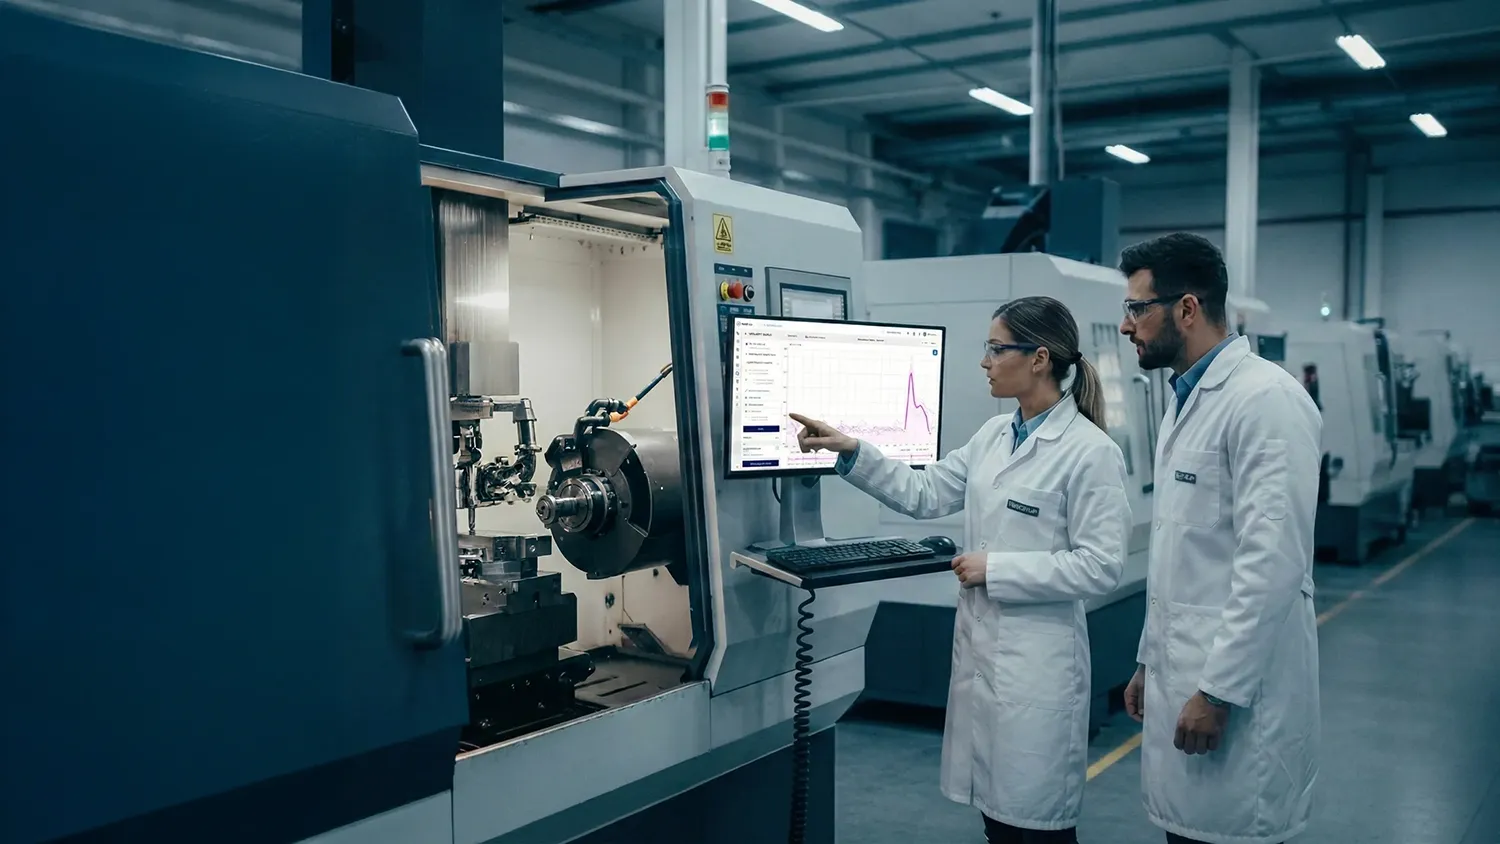
With TrendMiner, data from multiple machines and production lines can be visualised and analysed within minutes. TrendMiner provides the foundation for RUL estimation and seamless integration with external modelling tools, following three steps.
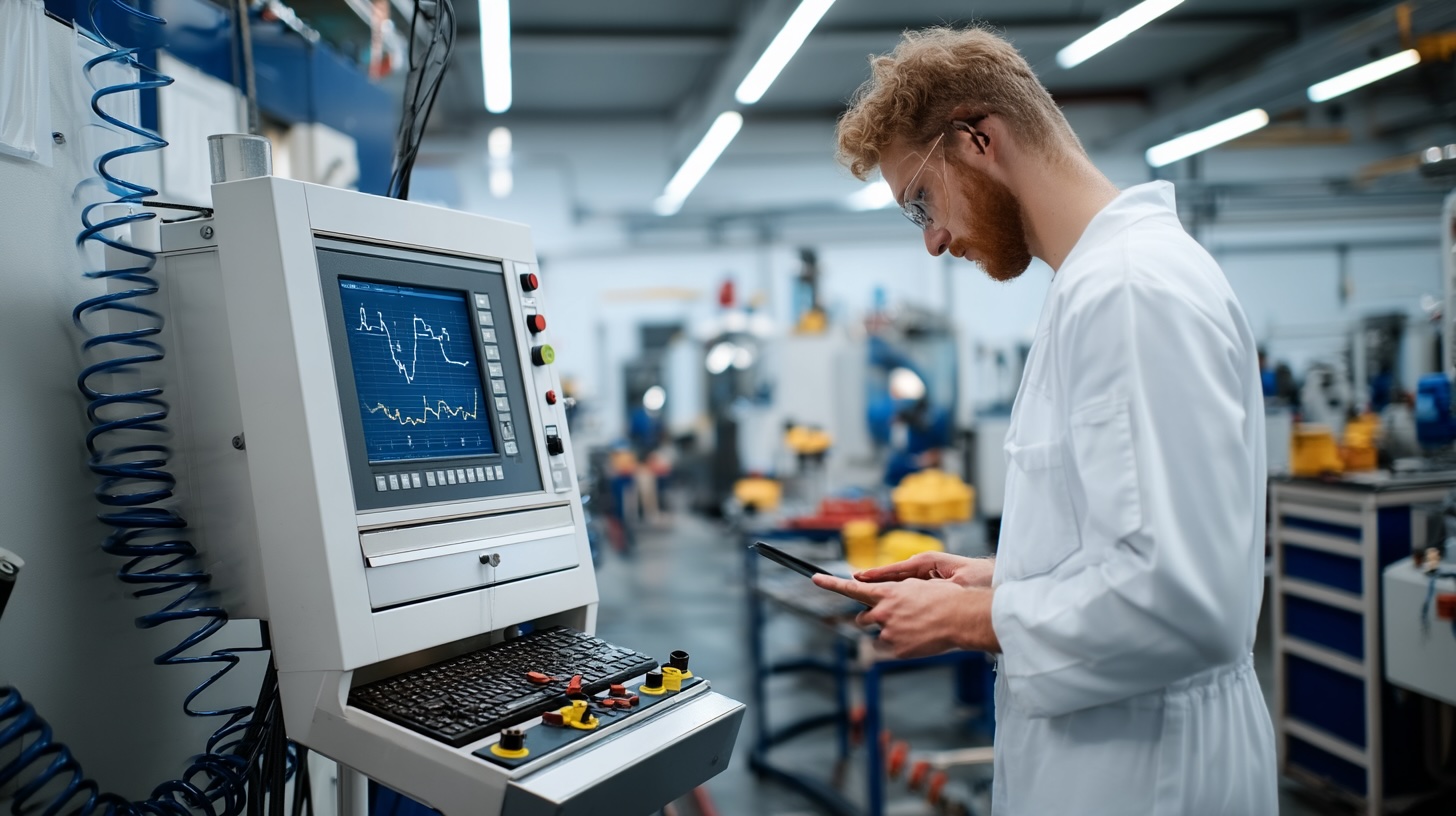
Step 1: Connect and Visualise Wear-Relevant Parameters
TrendMiner connects to existing data sources and visualises key parameters indicative of tool wear, including:
- Spindle load or motor current
- Vibration or acceleration
- Cutting force or torque
- Tool or spindle temperature
- Coolant flow rate
- Cycle count or runtime

Step 2: Build a Degradation Health Indicator and Predict RUL
Health indicators can be expressed at three levels of sophistication, each building on the previous.
Usage-based: RUL is calculated directly from cycle count — maximum cycles minus cycles used. Simple to implement with no modelling required, but blind to actual process conditions: every tool is replaced at the same point regardless of how hard it was actually run.
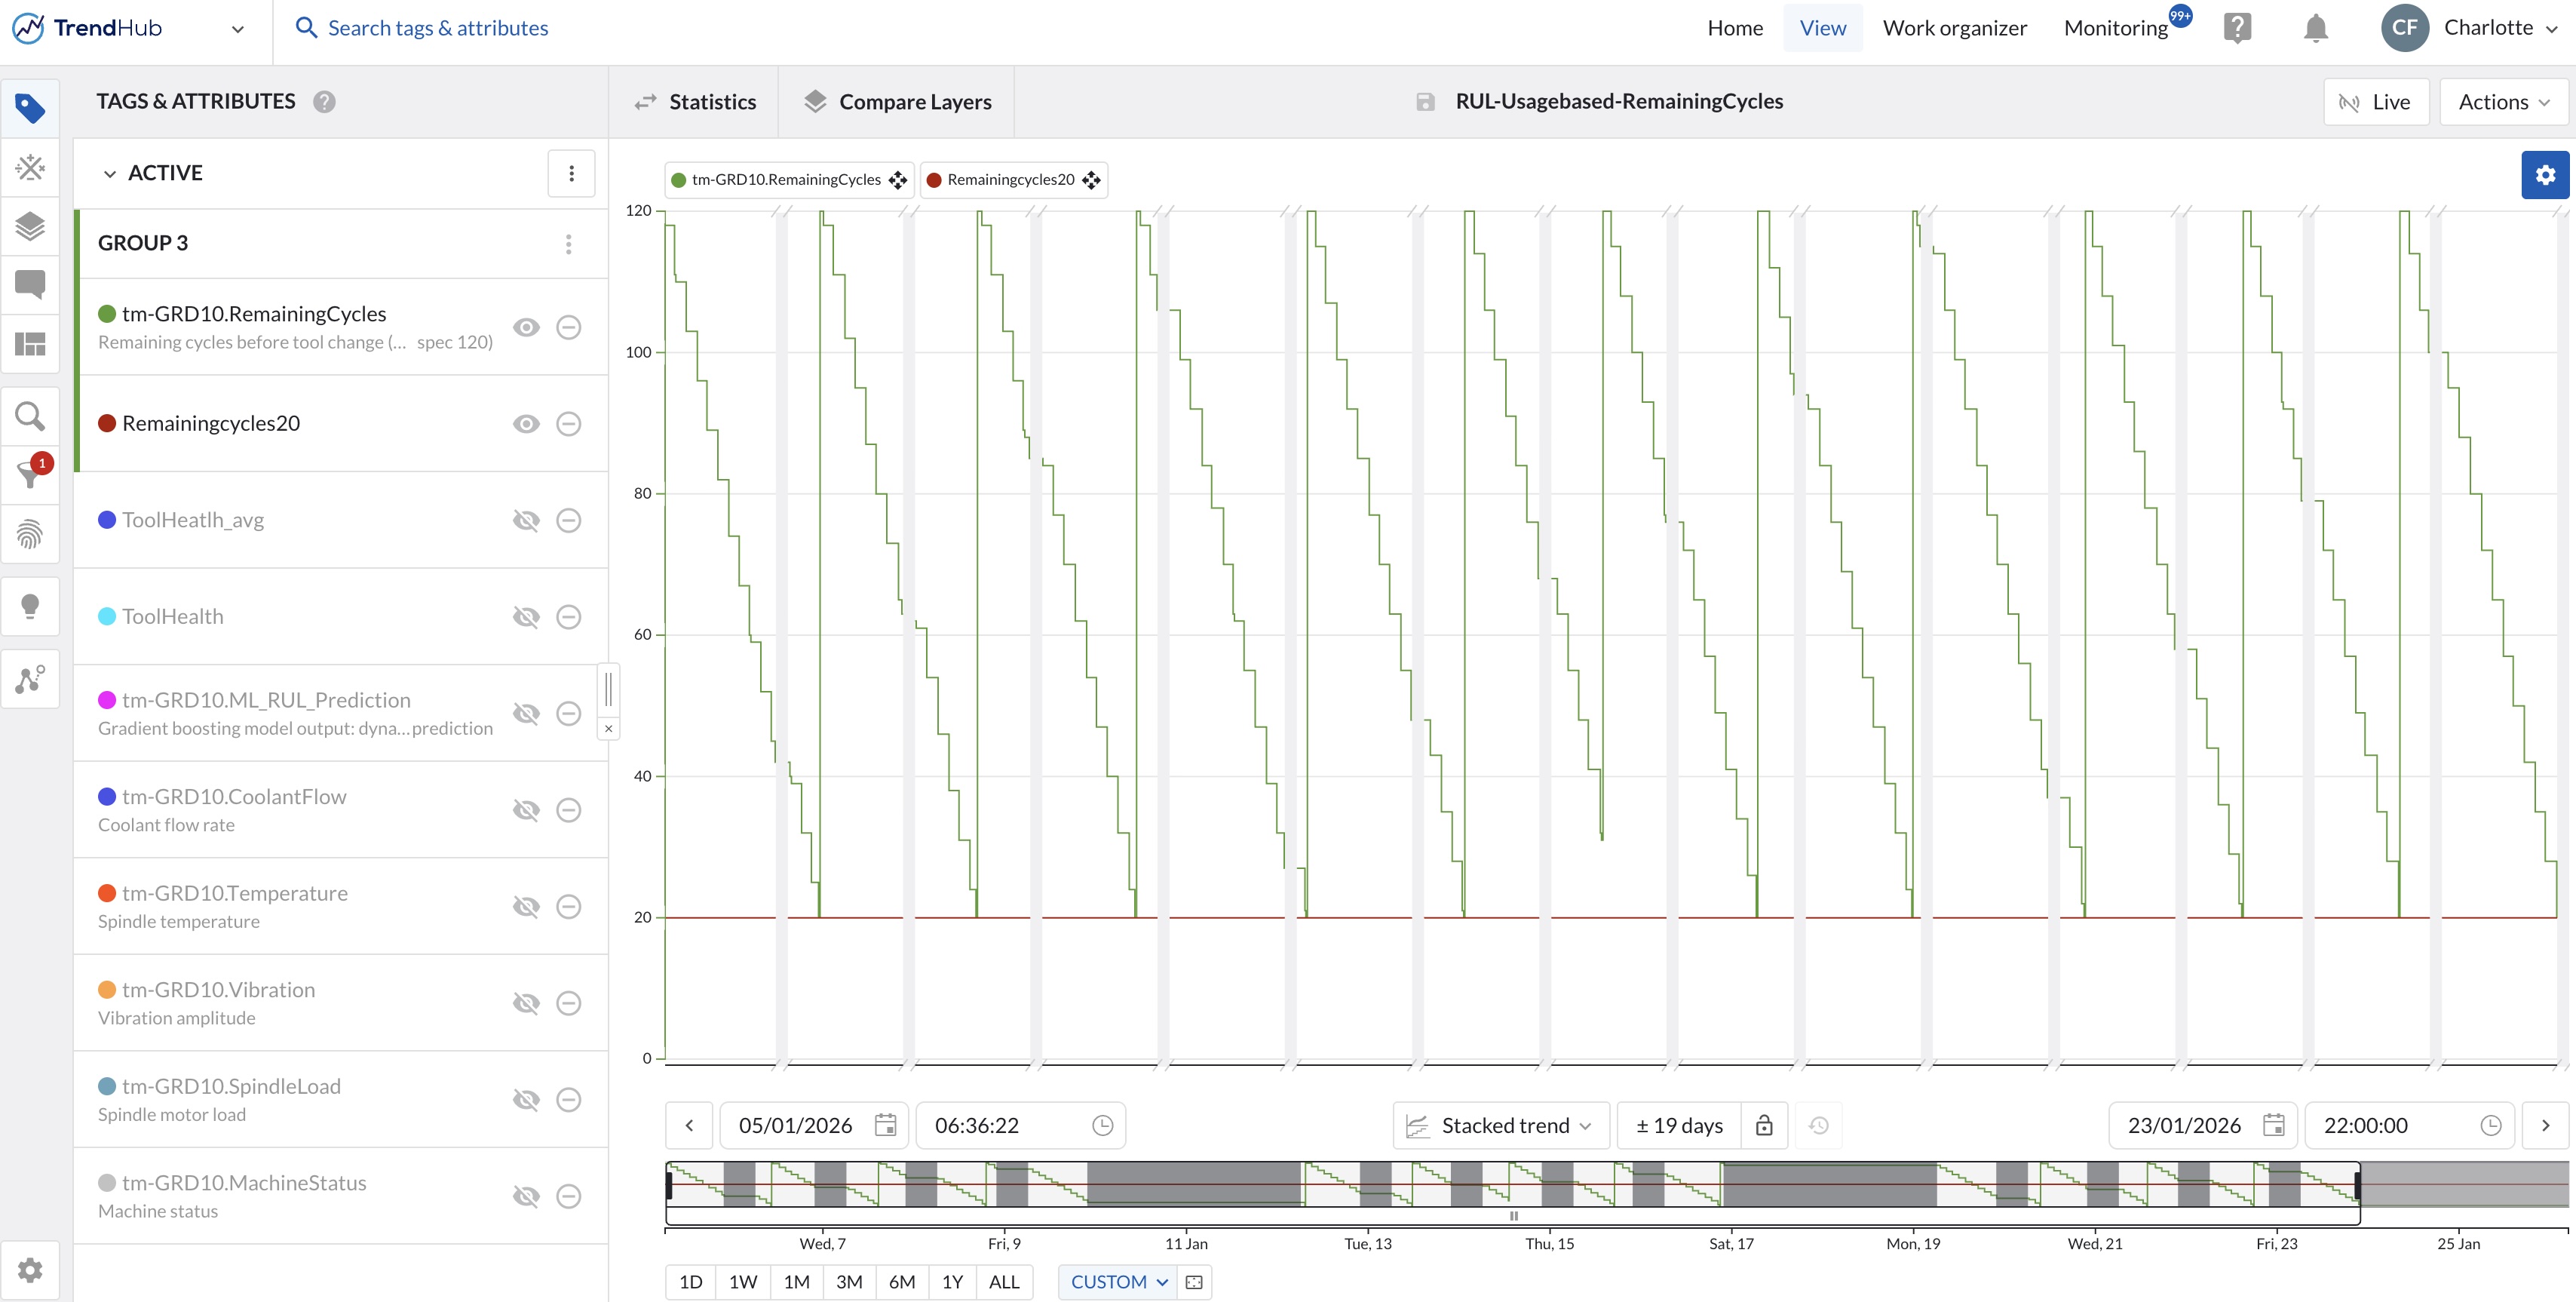
Parameter-based: Using Tag Builder, engineers combine wear-relevant parameters into a single tool health indicator that reflects actual condition rather than elapsed cycles. Reviewing past tool changes identifies which signals rise consistently before replacement — in this example, spindle load and temperature.

These parameters are normalized and combined into a health score:
ToolHealth = 100 − ((SpindleLoad / SpindleLoad_max + Temperature / Temperature_max) / 2) × 100
The score starts high on a fresh tool and declines as wear increases. Because the raw signal fluctuates with each cycle, it is aggregated over a fixed window to reveal a clean degradation trend. When the score crosses a threshold set from historical replacements, an alert fires — enabling condition-based rather than schedule-based tool changes.

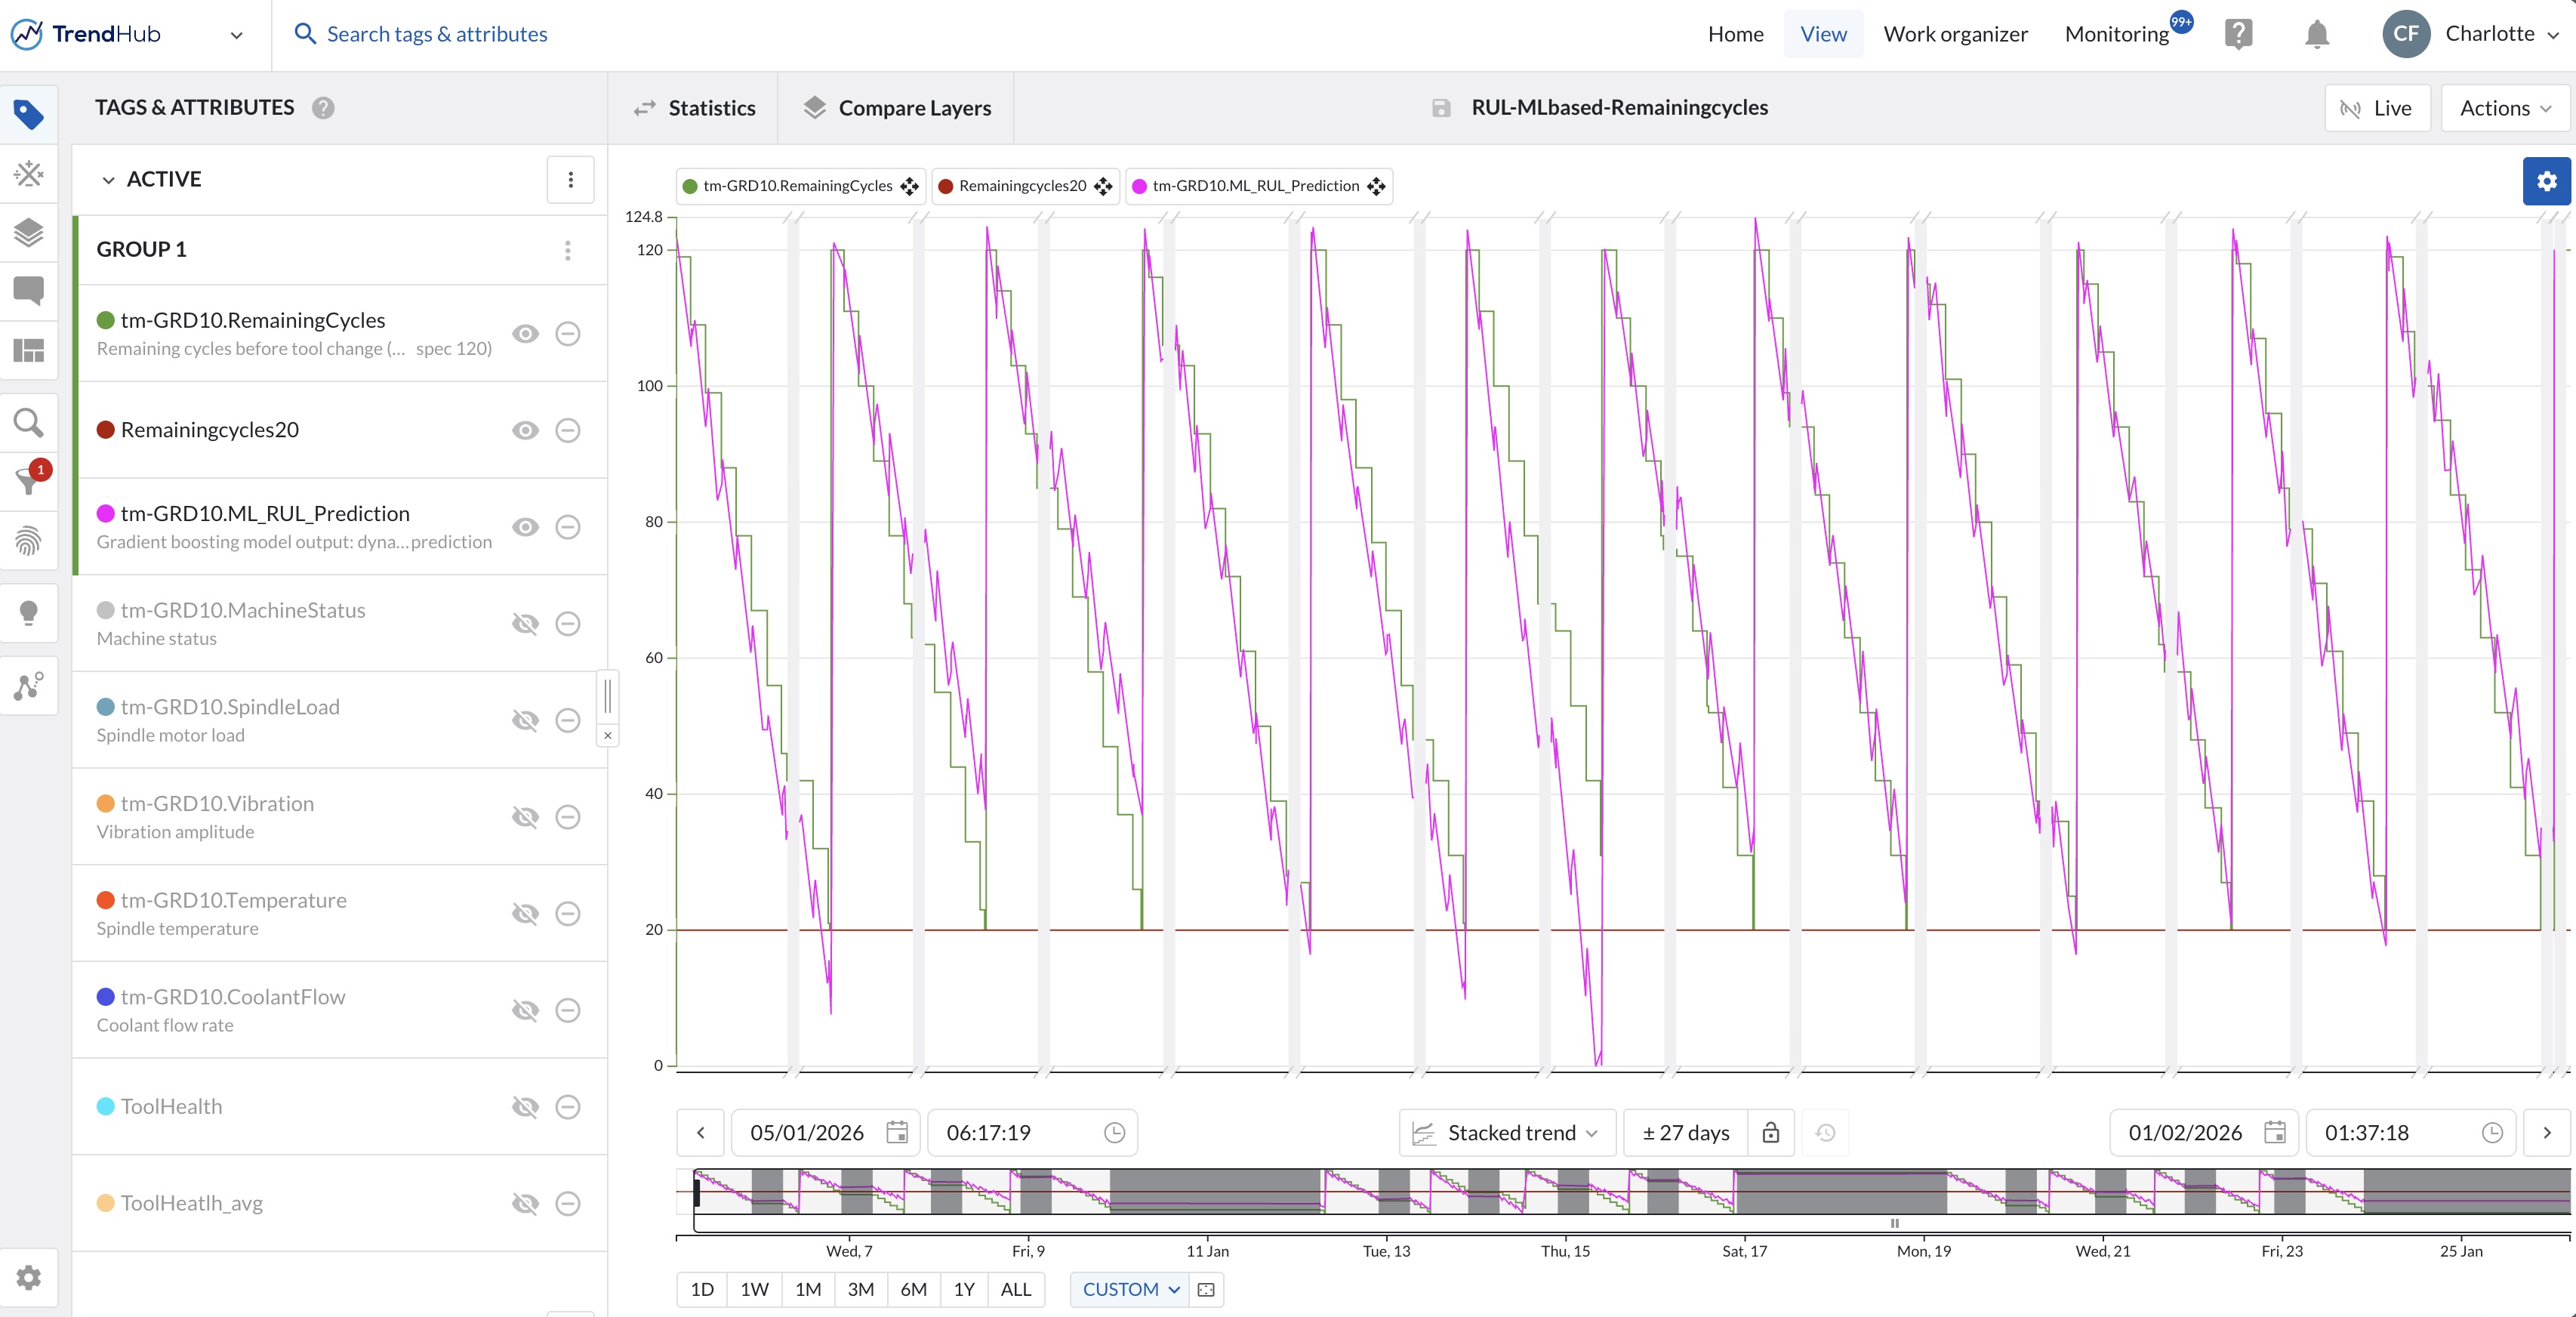
ML-based: For higher accuracy, a gradient boosting model trained on historical process data predicts RUL directly in cycles — the unit the engineer already works with. The model learns how the combination of load, vibration, and temperature relates to actual tool life, capturing patterns that a single fixed threshold cannot. It is built in an external environment such as Databricks, Azure ML, AWS SageMaker, or a local Jupyter notebook, then pushed back into TrendMiner as a tag and monitored like any other.
Step 3: Visualisation and Live Monitoring
Once RUL predictions are available as tags, TrendMiner provides full operational visibility:
- Live monitoring of RUL trends with automated alerts via email or webhooks when predicted RUL falls below defined thresholds or when critical parameters exceed limits
- Shopfloor dashboards integrated with MES, providing a shared overview of tool condition, RUL trends, and operational limits across production lines
All three approaches result in live RUL tags in TrendMiner that can be monitored, alerted on, and displayed on shopfloor dashboards.
The Value
Conservative replacement schedules waste tooling spend and production capacity; unplanned failures add product damage, scrap, and unplanned stops on top. Predictive RUL monitoring addresses both, driving OEE improvements consistent with industry benchmarks for predictive maintenance programmes of this type.
Why TrendMiner
Process analytics and ML integration are typically separate workflows, requiring separate tools and separate teams. TrendMiner sits at the intersection: it makes process data accessible and meaningful enough to be the foundation for reliable predictive models, and then closes the loop by bringing model outputs back into the operational environment where engineers work every day.
The result is a predictive maintenance workflow that process engineers can own and maintain without depending on a data science team for every update.
A single unplanned tool failure stops production. In high-value discrete manufacturing, an hour of unplanned downtime ranges from several thousand euros in smaller operations to over a million in the most capital-intensive environments. (Siemens True Cost of Downtime 2024, ABB Value of Reliability 2023). Predictive approaches consistently reduce unplanned downtime and extend equipment life. Applied across multiple assets, the value scales accordingly.
The challenge is knowing when a tool is actually approaching the end of its life. Replacing too early wastes usable tool life and production time. Replacing too late risks the failure that stops the line. Fixed maintenance schedules cannot resolve this tension because they ignore the actual condition of the tool. This is where Remaining Useful Life prediction comes in.
What is RUL?
Remaining Useful Life (RUL) is defined as the time remaining for a component to perform its intended function before failure. Accurate RUL estimation allows process experts to schedule maintenance proactively, avoid unplanned downtime, and reduce unnecessary replacement costs. For this reason, RUL estimation is a key focus in predictive maintenance programs across discrete and process manufacturing.
The Challenge
In precision manufacturing environments, tool condition directly determines dimensional accuracy and surface quality. A single undetected tool failure can compromise an entire production run, resulting in scrap, rework, and unplanned downtime.
Traditionally, extensive data engineering was required to clean and prepare data for each machine individually. Tool changes were performed on fixed time schedules because neither a standardised prediction workflow existed, nor live monitoring was possible. As a result, actual tool condition remained largely unknown, increasing the risk of premature failures or underutilised tool life.
The Approach
With TrendMiner, data from multiple machines and production lines can be visualised and analysed within minutes. TrendMiner provides the foundation for RUL estimation and seamless integration with external modelling tools, following three steps.
Step 1: Connect and Visualise Wear-Relevant Parameters
TrendMiner connects to existing data sources and visualises key parameters indicative of tool wear, including:
- Spindle load or motor current
- Vibration or acceleration
- Cutting force or torque
- Tool or spindle temperature
- Coolant flow rate
- Cycle count or runtime
Step 2: Build a Degradation Health Indicator and Predict RUL
Health indicators can be expressed at three levels of sophistication, each building on the previous.
Usage-based: RUL is calculated directly from cycle count — maximum cycles minus cycles used. Simple to implement with no modelling required, but blind to actual process conditions: every tool is replaced at the same point regardless of how hard it was actually run.
Parameter-based: Using Tag Builder, engineers combine wear-relevant parameters into a single tool health indicator that reflects actual condition rather than elapsed cycles. Reviewing past tool changes identifies which signals rise consistently before replacement — in this example, spindle load and temperature.
These parameters are normalized and combined into a health score:
ToolHealth = 100 − ((SpindleLoad / SpindleLoad_max + Temperature / Temperature_max) / 2) × 100
The score starts high on a fresh tool and declines as wear increases. Because the raw signal fluctuates with each cycle, it is aggregated over a fixed window to reveal a clean degradation trend. When the score crosses a threshold set from historical replacements, an alert fires — enabling condition-based rather than schedule-based tool changes.
ML-based: For higher accuracy, a gradient boosting model trained on historical process data predicts RUL directly in cycles — the unit the engineer already works with. The model learns how the combination of load, vibration, and temperature relates to actual tool life, capturing patterns that a single fixed threshold cannot. It is built in an external environment such as Databricks, Azure ML, AWS SageMaker, or a local Jupyter notebook, then pushed back into TrendMiner as a tag and monitored like any other.
Step 3: Visualisation and Live Monitoring
Once RUL predictions are available as tags, TrendMiner provides full operational visibility:
- Live monitoring of RUL trends with automated alerts via email or webhooks when predicted RUL falls below defined thresholds or when critical parameters exceed limits
- Shopfloor dashboards integrated with MES, providing a shared overview of tool condition, RUL trends, and operational limits across production lines
All three approaches result in live RUL tags in TrendMiner that can be monitored, alerted on, and displayed on shopfloor dashboards.
The Value
Conservative replacement schedules waste tooling spend and production capacity; unplanned failures add product damage, scrap, and unplanned stops on top. Predictive RUL monitoring addresses both, driving OEE improvements consistent with industry benchmarks for predictive maintenance programmes of this type.
Why TrendMiner
Process analytics and ML integration are typically separate workflows, requiring separate tools and separate teams. TrendMiner sits at the intersection: it makes process data accessible and meaningful enough to be the foundation for reliable predictive models, and then closes the loop by bringing model outputs back into the operational environment where engineers work every day.
The result is a predictive maintenance workflow that process engineers can own and maintain without depending on a data science team for every update.
Access now
Share with a co-worker
A single unplanned tool failure stops production. In high-value discrete manufacturing, an hour of unplanned downtime ranges from several thousand euros in smaller operations to over a million in the most capital-intensive environments. (Siemens True Cost of Downtime 2024, ABB Value of Reliability 2023). Predictive approaches consistently reduce unplanned downtime and extend equipment life. Applied across multiple assets, the value scales accordingly.
The challenge is knowing when a tool is actually approaching the end of its life. Replacing too early wastes usable tool life and production time. Replacing too late risks the failure that stops the line. Fixed maintenance schedules cannot resolve this tension because they ignore the actual condition of the tool. This is where Remaining Useful Life prediction comes in.
What is RUL?
Remaining Useful Life (RUL) is defined as the time remaining for a component to perform its intended function before failure. Accurate RUL estimation allows process experts to schedule maintenance proactively, avoid unplanned downtime, and reduce unnecessary replacement costs. For this reason, RUL estimation is a key focus in predictive maintenance programs across discrete and process manufacturing.
The Challenge
In precision manufacturing environments, tool condition directly determines dimensional accuracy and surface quality. A single undetected tool failure can compromise an entire production run, resulting in scrap, rework, and unplanned downtime.
Traditionally, extensive data engineering was required to clean and prepare data for each machine individually. Tool changes were performed on fixed time schedules because neither a standardised prediction workflow existed, nor live monitoring was possible. As a result, actual tool condition remained largely unknown, increasing the risk of premature failures or underutilised tool life.
The Approach
With TrendMiner, data from multiple machines and production lines can be visualised and analysed within minutes. TrendMiner provides the foundation for RUL estimation and seamless integration with external modelling tools, following three steps.
Step 1: Connect and Visualise Wear-Relevant Parameters
TrendMiner connects to existing data sources and visualises key parameters indicative of tool wear, including:
- Spindle load or motor current
- Vibration or acceleration
- Cutting force or torque
- Tool or spindle temperature
- Coolant flow rate
- Cycle count or runtime
Step 2: Build a Degradation Health Indicator and Predict RUL
Health indicators can be expressed at three levels of sophistication, each building on the previous.
Usage-based: RUL is calculated directly from cycle count — maximum cycles minus cycles used. Simple to implement with no modelling required, but blind to actual process conditions: every tool is replaced at the same point regardless of how hard it was actually run.
Parameter-based: Using Tag Builder, engineers combine wear-relevant parameters into a single tool health indicator that reflects actual condition rather than elapsed cycles. Reviewing past tool changes identifies which signals rise consistently before replacement — in this example, spindle load and temperature.
These parameters are normalized and combined into a health score:
ToolHealth = 100 − ((SpindleLoad / SpindleLoad_max + Temperature / Temperature_max) / 2) × 100
The score starts high on a fresh tool and declines as wear increases. Because the raw signal fluctuates with each cycle, it is aggregated over a fixed window to reveal a clean degradation trend. When the score crosses a threshold set from historical replacements, an alert fires — enabling condition-based rather than schedule-based tool changes.
ML-based: For higher accuracy, a gradient boosting model trained on historical process data predicts RUL directly in cycles — the unit the engineer already works with. The model learns how the combination of load, vibration, and temperature relates to actual tool life, capturing patterns that a single fixed threshold cannot. It is built in an external environment such as Databricks, Azure ML, AWS SageMaker, or a local Jupyter notebook, then pushed back into TrendMiner as a tag and monitored like any other.
Step 3: Visualisation and Live Monitoring
Once RUL predictions are available as tags, TrendMiner provides full operational visibility:
- Live monitoring of RUL trends with automated alerts via email or webhooks when predicted RUL falls below defined thresholds or when critical parameters exceed limits
- Shopfloor dashboards integrated with MES, providing a shared overview of tool condition, RUL trends, and operational limits across production lines
All three approaches result in live RUL tags in TrendMiner that can be monitored, alerted on, and displayed on shopfloor dashboards.
The Value
Conservative replacement schedules waste tooling spend and production capacity; unplanned failures add product damage, scrap, and unplanned stops on top. Predictive RUL monitoring addresses both, driving OEE improvements consistent with industry benchmarks for predictive maintenance programmes of this type.
Why TrendMiner
Process analytics and ML integration are typically separate workflows, requiring separate tools and separate teams. TrendMiner sits at the intersection: it makes process data accessible and meaningful enough to be the foundation for reliable predictive models, and then closes the loop by bringing model outputs back into the operational environment where engineers work every day.
The result is a predictive maintenance workflow that process engineers can own and maintain without depending on a data science team for every update.
Access now
Subscribe to our newsletter
Stay up to date with our latest news and updates.
Webinars on Demand
Press Play on Operational Improvement
No items found.
Other Resources
Explore Our Newest Content to Maximize Your Operational Efficiency