Blog
Innovating Industry Insights
Stay informed with our latest blog articles.
Latest post
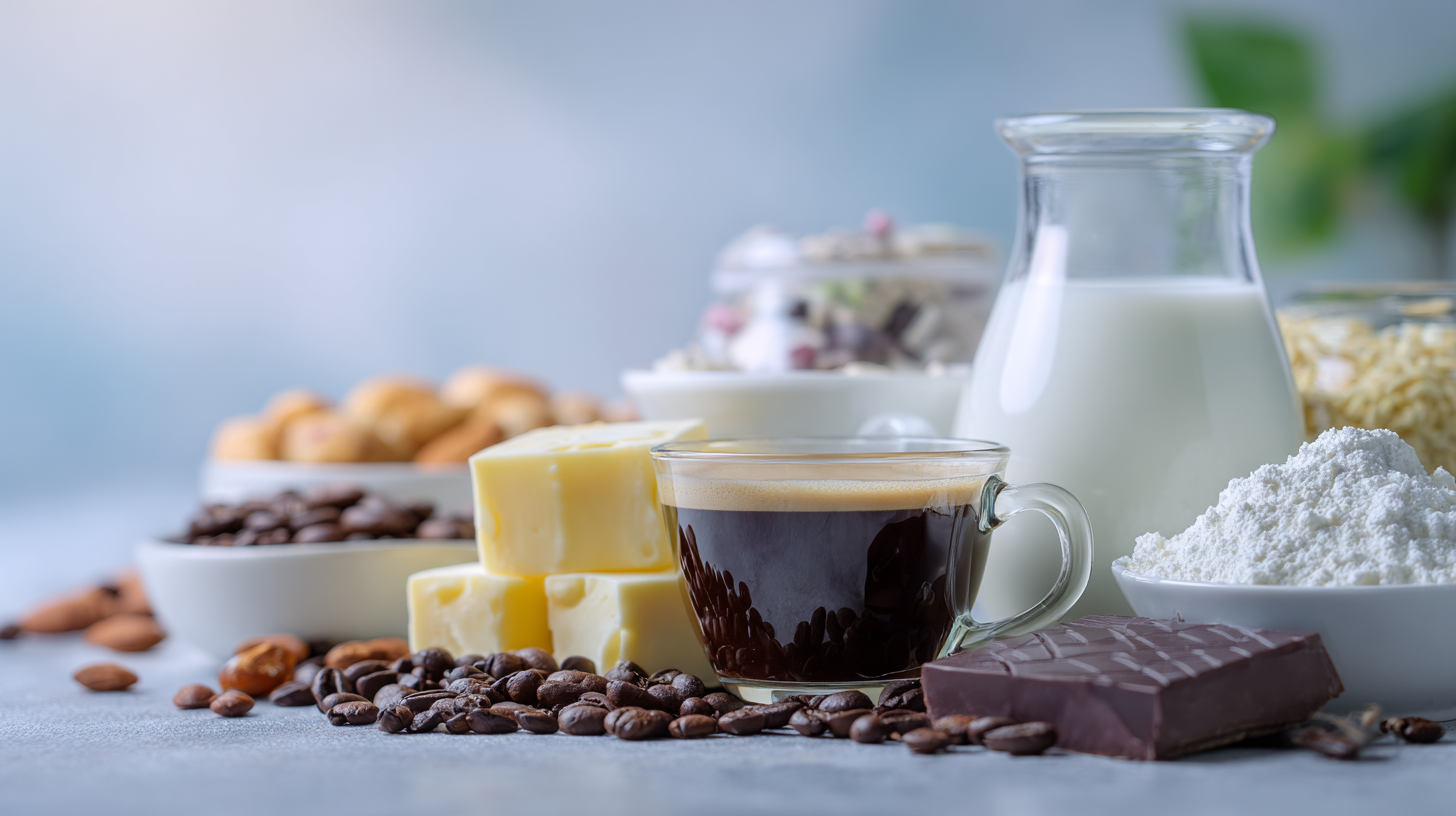
Maximizing Performance in Food & Beverages Manufacturing with TrendMiner
July 14, 2025
From coffee beans to chocolate bars, leading food-and-beverage plants are supercharging throughput and slashing downtime with TrendMiner’s real-time analytics. Discover how data-driven insights turn cleaning cycles, evaporator fouling, and pasteurization hiccups into opportunities for 24/7 efficiency and consistent, top-quality products.
Thank you! Your submission has been received!
Oops! Something went wrong while submitting the form.
Filters
Thank you! Your submission has been received!
Oops! Something went wrong while submitting the form.