Maximizing Performance in Food & Beverage Manufacturing with TrendMiner
In the Food & Beverage industry, every sub‑sector faces unique challenges—from maximizing throughput to ensuring consistent quality and product safety.This article highlights how leading producers in milk, coffee, infant cereals, sugar, and chocolate use TrendMiner to drive data‑based decisions, unlocking efficiency and excellence on the shop floor.
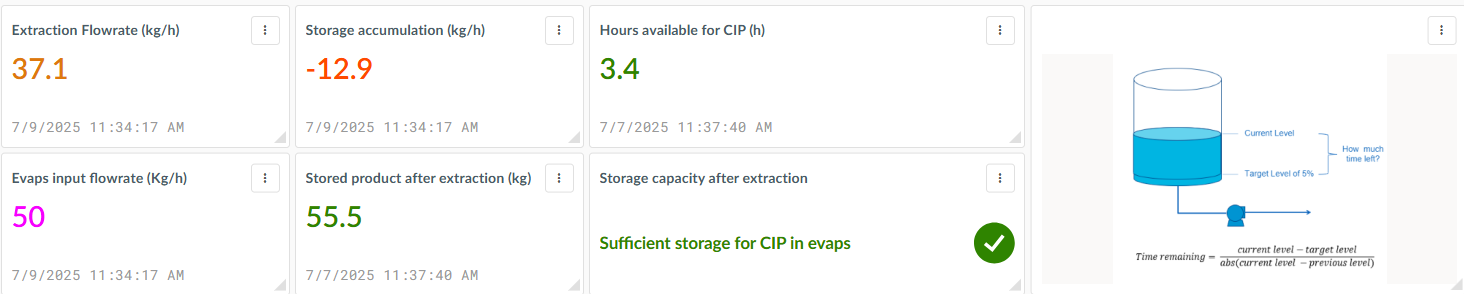
Coffee – Extraction Line Balancing
- We track tank levels, flowrates, and downstream asset availability in real time—visualizing storage utilization and production capacity through intuitive dashboards.
- We calculate total storage availability and forecast how many hours the extraction unit can keep running at full nominal speed, even when downstream evaporators are undergoing CIP or maintenance.
- We balance lines and adjust cleaning schedules to keep the extraction unit—the main bottleneck—running at 100% nominal speed.
The result? Continuous extraction, maximum throughput, and consistent production of high‑quality coffee solids—powered by real‑time insights and proactive process management.
But downtime in Food & Beverage often has a common cause: cleaning cycles. In milk factories, Clean-in-Place (CIP) operations are a major source of production loss. Here's how we tackled it with TrendMiner:
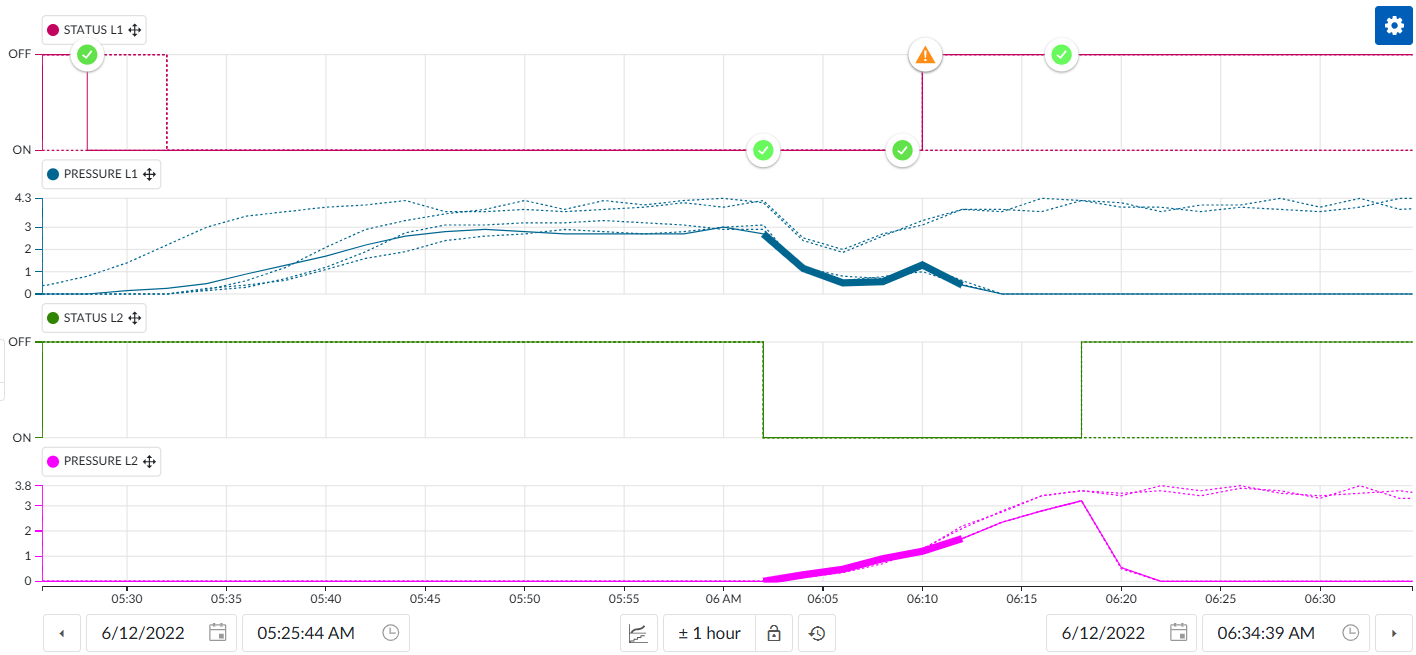
Dairy – CIP Optimization
- We track all asset statuses and classify them by duration using intuitive Gantt charts.
- We monitor, analyze, and optimize CIP cycles—highlighting excessive cleaning durations, unnecessary resource usage, and opportunities for time and cost savings.
- We identify the “golden batch”—the ideal CIP profile—enabling teams to compare each cleaning event against the optimal curve to quickly detect process deviations and inefficiencies.
The result? Smarter CIP processes and clear insight into potential reductions in water, chemicals, time, and money.
Traditionally, cleaning intervals have been based on assumptions rather than data. Yet, in F&B, evaporators are everywhere—and fouling is one of the biggest challenges.
Evaporators – Smart Cleaning Through Fouling Detection
With TrendMiner:
- We monitor key KPIs like the overall heat transfer coefficient (U).
- Experts define acceptable thresholds, and we automate the rest.
This data-driven approach led to:
- 7% throughput increase
- 20% fewer CIPs
Just by cleaning only when and where it's truly needed.


Picture 3 – U coefficient formula, chart with corresponding limit and corresponding live monitor.
Throughput, as we have seen, is crucial, but quality is king — and so is product safety. To achieve both, it's key to control and maintain stability at Critical Control Points (CCPs) and in key variables that directly impact product quality.This is especially true in a pasteurization unit within the infant cereal process, where temperature plays a vital role in ensuring not only food safety compliance but also maintaining the desired product quality.
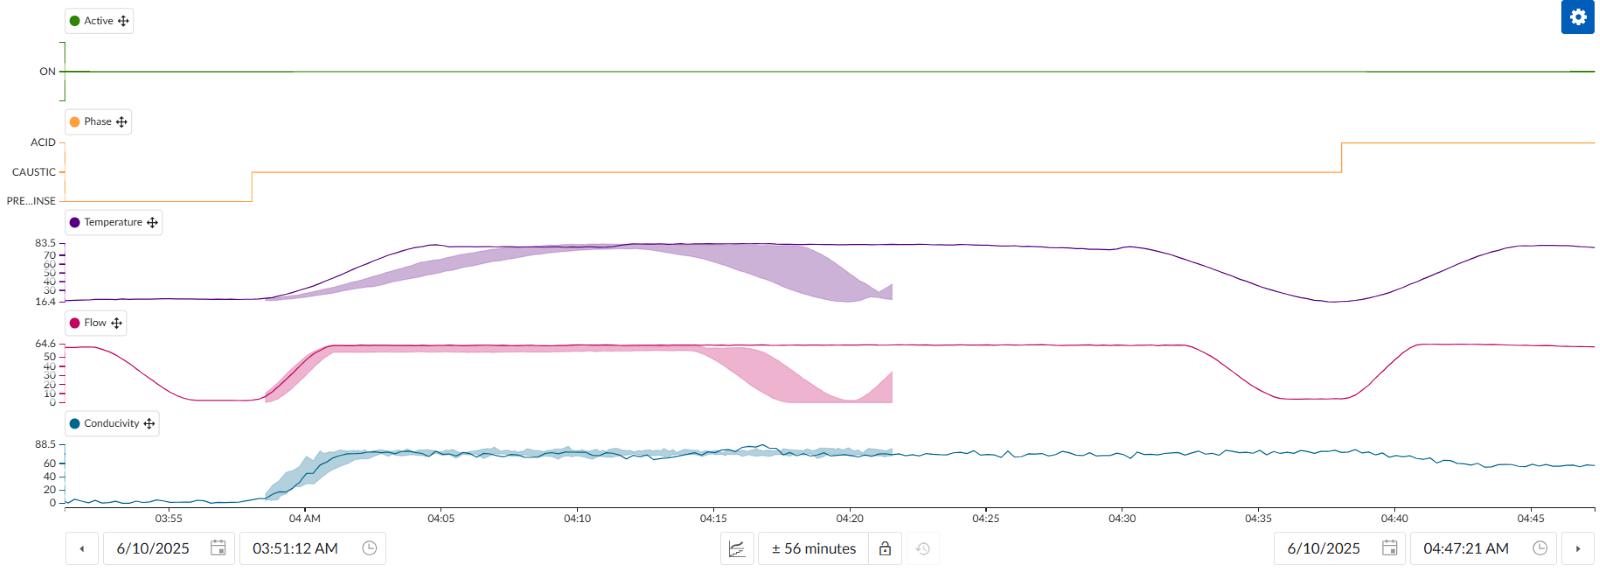
Infant Cereal – Optimizing a Pasteurization Unit
With TrendMiner:
- We analyze past downtimes in the pasteurization unit to detect patterns using our Pattern Recognition Engine.
- This allows us to automatically identify similar process events, compare them with normal or optimal cycles, and pinpoint recurring causes of disruptions.
- Root causes are identified, tracked, and monitored through live dashboards, enabling teams to take corrective action and prevent future occurrences.
The result? A smarter, more consistent pasteurization process with stable temperature—driven by real-time insights.
Sometimes, the key to improvement is comparing similar assets. In a sugar factory, this was crucial to perfecting the crystallization process.
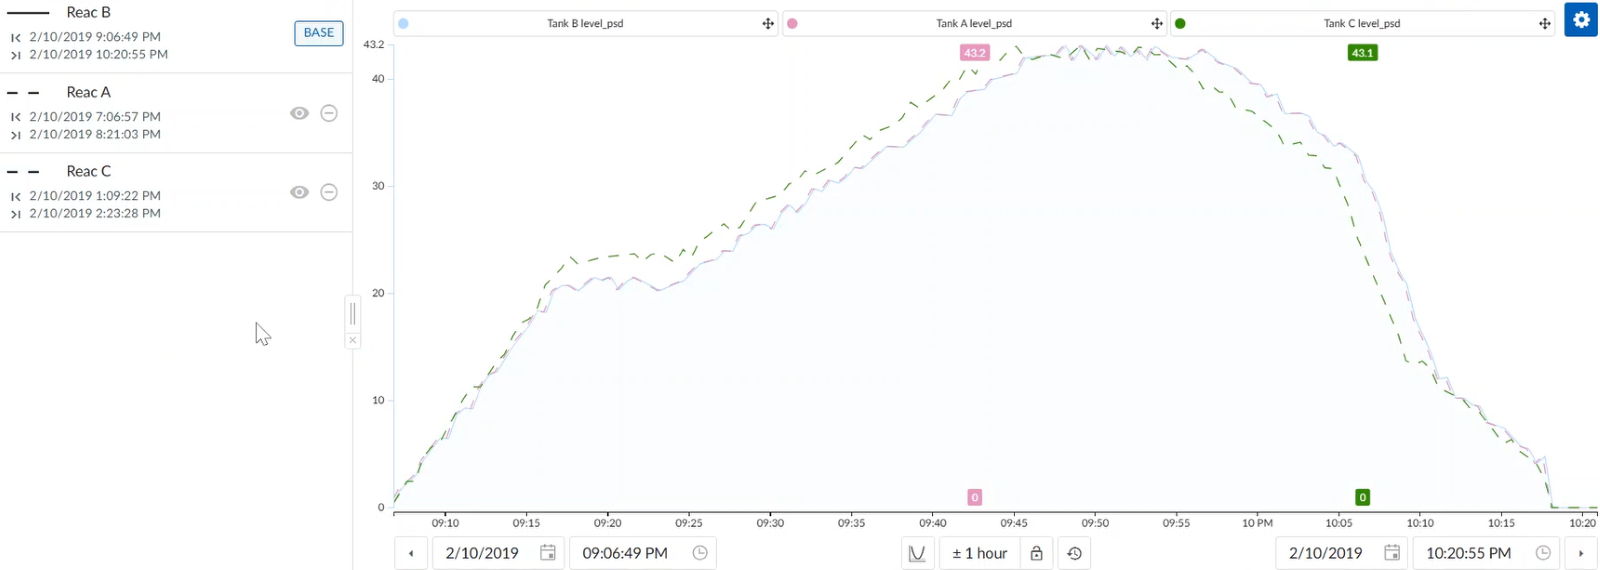
Sugar – Crystallization & Quality Benchmarking
TrendMiner enabled the team to:
- Compare critical assets side-by-side
- Achieve greater process stability and consistent product quality
Both throughput and quality improvements need to be visible across the organization. In a chocolate factory, TrendMiner’s interactive dashboards provided that 360° view.
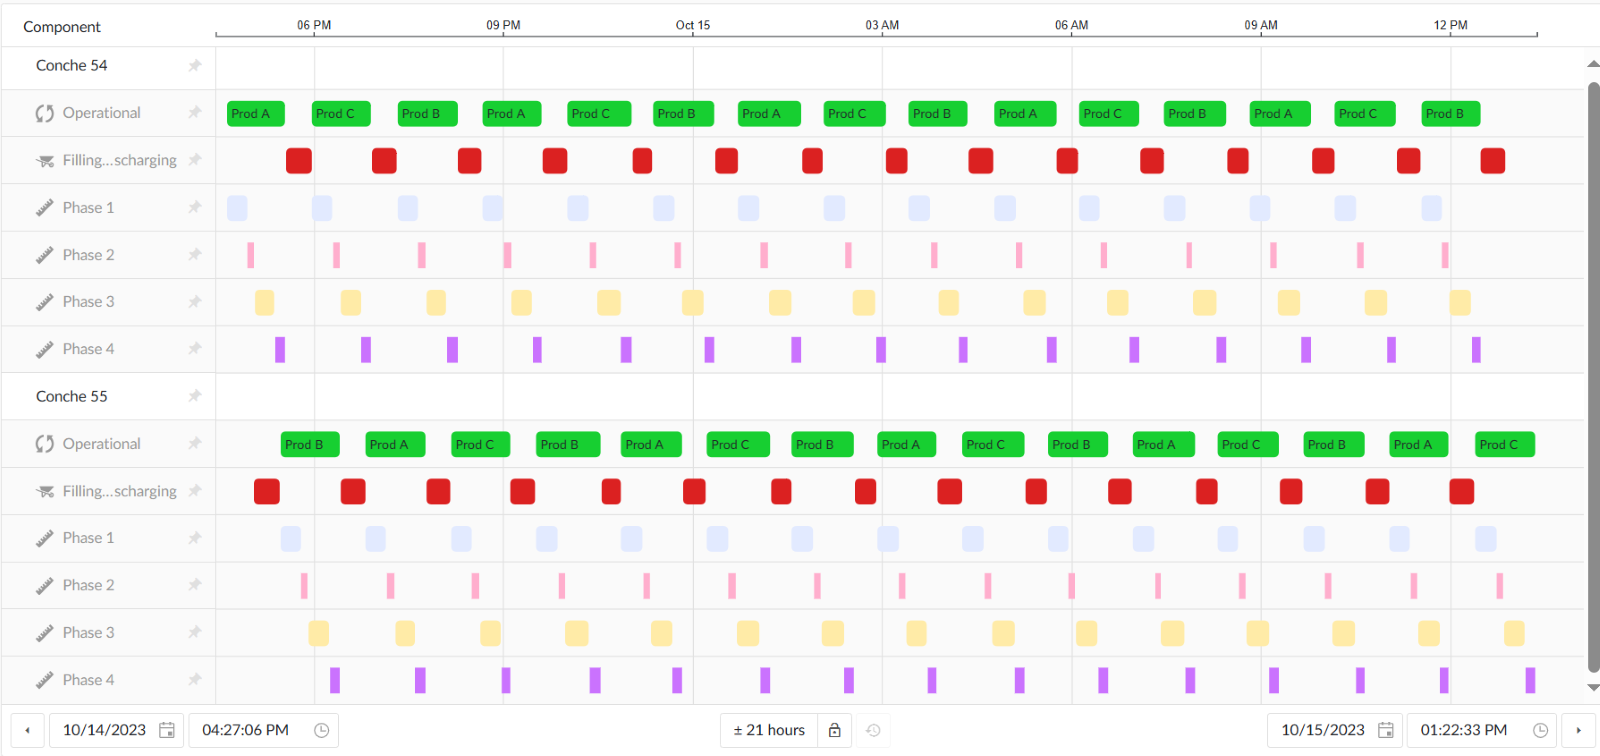
Chocolate – Conching Optimization & Sustainability
- Teams can visualize and compare short vs. long conching cycles
- Detect optimal operating windows that ensure top-quality chocolate
- Minimize energy consumption—supporting sustainability goals
From coffee to chocolate, TrendMiner is transforming F&B production—unlocking operational excellence, smarter cleaning, and real-time quality assurance, all while empowering teams with the insights they need to make better, faster decisions.
Ready to optimize your factory floor?